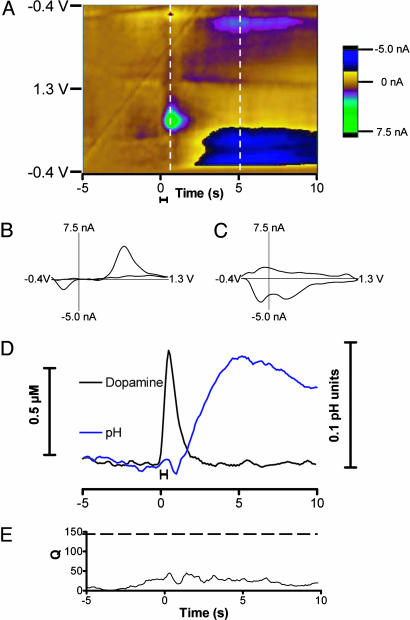
Fig. 1.
Electrically evoked dopamine release. (A) Color representation of voltammograms obtained during electrical stimulation of dopaminergic neurons. The solid bar under the color plot reflects the duration of the stimulation (24 pulses at 60 Hz). The abscissa is time, and applied potential is plotted on the ordinate. Each successive cyclic voltammogram is plotted with the current shown in false color. (B) A cyclic voltammogram of dopamine taken at the end of the stimulation indicated by the first vertical line on the color plot. (C) A cyclic voltammogram of a basic change in pH taken 5 s after the stimulation at the time indicated by the second vertical line. (D) Changes in dopamine concentration and pH generated by principal component regression from the data shown in A.(E) The residual (Q) associated with the collected data.

