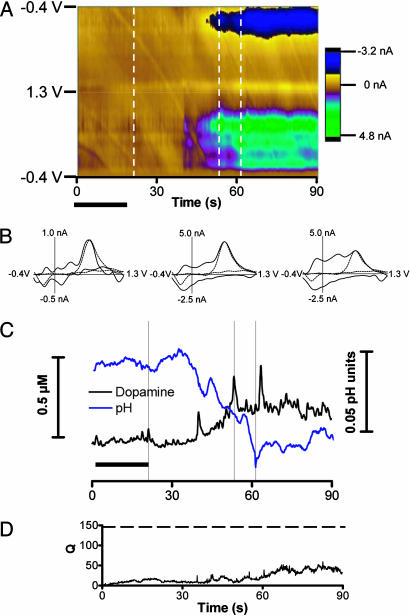
Fig. 2.
Voltammetric changes after an i.v. cocaine infusion. (A) Color representation of voltammograms obtained after an i.v. infusion of cocaine (0.3 mg/kg). The infusion time is denoted by the solid horizontal bars beneath the color plot. Data are plotted as described for Fig. 1. (B) Cyclic voltammograms recorded at 22, 52, and 61 s after the infusion (times are indicated by the vertical bars). The cyclic voltammograms represented with the dashed lines are those obtained with electrical stimulation. The correlation coefficients (r) for the voltammograms with that recorded during electrical stimulation are 0.83, 0.84, and 0.61, respectively. (C) Changes in dopamine concentration and pH generated by principal component regression. (D) The residual (Q) associated with the collected data.

