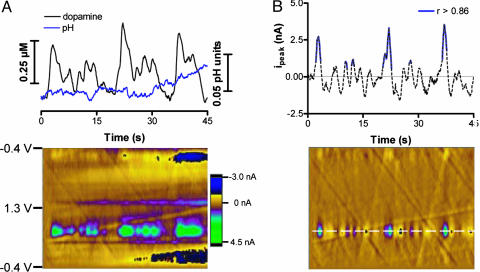
Fig. 3.
Dopamine concentration transients after cocaine. (A) Results obtained with principal component regression. (Upper) Changes in pH and dopamine concentration. (Lower) Two-dimensional color representation of the background-subtracted cyclic voltammograms collected 90 s after cocaine (1.0 mg/kg) infusion. (B) Results from the same data as shown in A obtained with the differential method. The current at 0.65 V (Upper) is plotted versus time; the solid blue line indicates where dopamine was identified (r > 0.86). (Lower) Two-dimensional color representation of the cyclic voltammograms after the differential method was applied.

