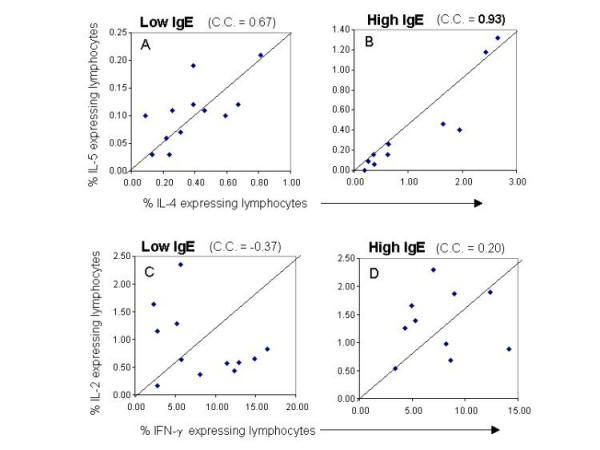
Figure 5.

Coordinate regulation of the frequency of IL-4 and IL-5 expressing lymphocytes from high or low anti-SWAP IgE responders. The data is presented in a correlation plot considering IL-4 and IL-5 or IFN-γ and IL-2 for individual patients from the IgE low (A,C) and high (B,D) groups. The correlation coefficient was calculated using Jump Statistics program.
