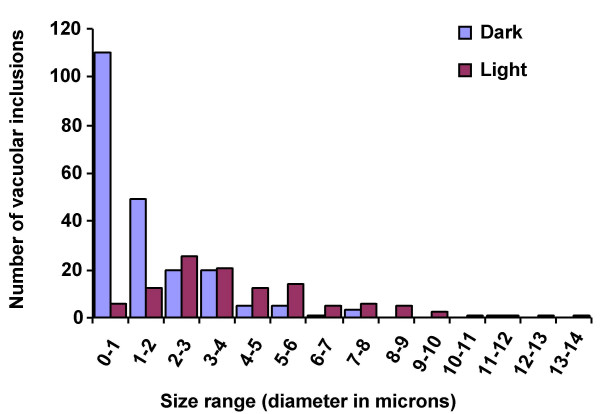
Figure 7.
Comparison of the size distribution of vacuolar inclusion containing anthocyanins in BMS35S::R+35S::C1 cells grown in the light or the dark. Round vacuolar inclusions were measured and classified according to the size range measured in microns (μm) that they fell into. Blue and red bars represent the AVI sizes in dark- and light-grown cells, respectively.

