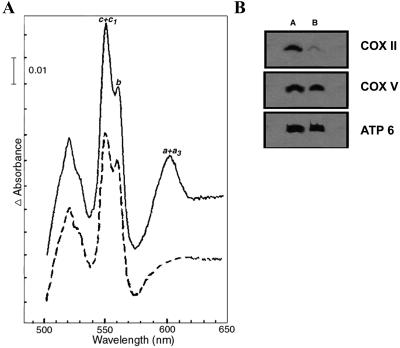
Figure 3.
Release of CytC parallels a reduction of cytochrome c oxidase in acid-treated cells. (A) Cytochrome spectra. Cytochrome spectra of S. cerevisiae mitochondria isolated from untreated cells (full line) or from cells treated with 140 mM acetic acid (dashed line). The α absorption bands corresponding to cytochromes a+a3 have maxima at 603 nm. The corresponding maximum for cytochrome b is 560 nm and for cytochrome c+c1, 550 nm. (B) Steady-state levels of COX II subunit are decreased in mitochondria from acid-treated cells. Immunodetection of COX II and V and ATPase 6 subunits in mitochondrial membranes of S. cerevisiae untreated cells (A) or cells treated with 140 mM acetic acid (B).

