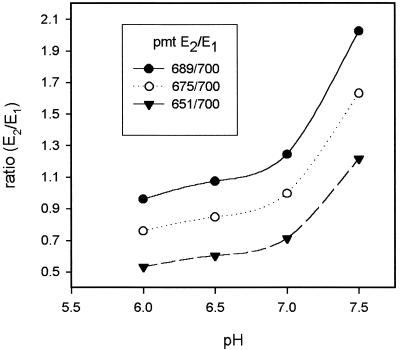
Figure 3.
In vitro calibrations with 50 μm SNARF-1 dextran (10 kD): pH dependence of emission intensity ratio E2 (620–670 nm)/E1 (550–600 nm) for different photomultiplier settings. An increase in the photomultiplier setting for E2 leads to an approximately parallel shift in the ratio values with only a slight increase in slope.

