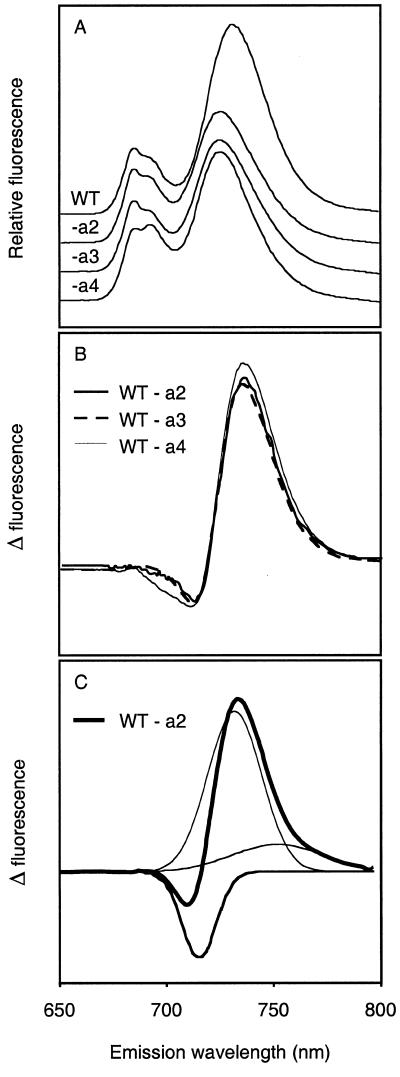
Figure 4.
Analysis of 77-K fluorescence emission spectra of wild-type (WT), Lhca2 (-a2), Lhca3 (-a3), and Lhca4 (-a4) antisense plants. A, Seventy-seven-Kelvin fluorescence emission spectra for excitation at 440 nm. The spectra were normalized to the 680-nm peak. B, Difference spectra of corresponding wild-type and antisense plants for Lhca2, Lhca3, and Lhca4. C, Gaussian deconvolution of the Lhca2 difference spectrum shown in Figure 4B and by the thickest solid line. The deconvolution of the Lhca3 and Lhca4 spectra was virtually identical to that of the Lhca2.

