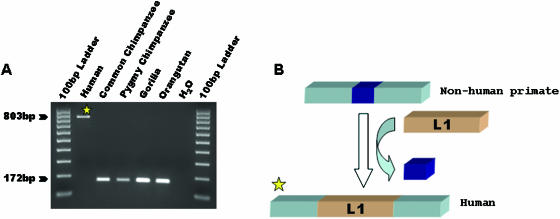
Figure 1.
L1IMD in the human genome. (A) Gel chromatograph of PCR products from a phylogenetic analysis of the human-specific L1IMD. The DNA template used in each lane is shown at top. The product sizes for filled and empty alleles are indicated at the left. (B) Schematic diagram depicting the insertion of the L1 element (orange boxes) and the deletion of genomic DNA (blue boxes). Flanking unique DNA sequences are shown as light blue boxes.

