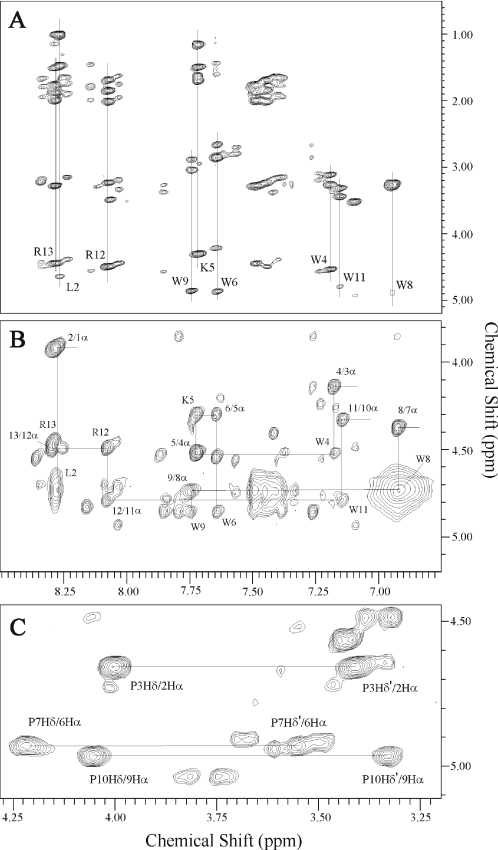
Figure 2.
Portions of the 2D proton NMR spectra of indolicidin in 50% TFE at pH 3.0 and 310K, illustrating resonance assignments. (A) TOCSY spectrum showing the backbone amide side-chain region. Individual amino acid spin systems are indicated by the vertical lines. (B) NOESY spectrum showing sequential amino acid residue assignments using cross-peaks between a backbone amide proton and the α-protein of the preceding residue. (C) NOESY spectrum showing the strong NOE cross-peaks between the δ-protons of proline and the α-protons of the preceding residue (connected by a horizontal line) that indicate the all-trans conformation of proline resides.

