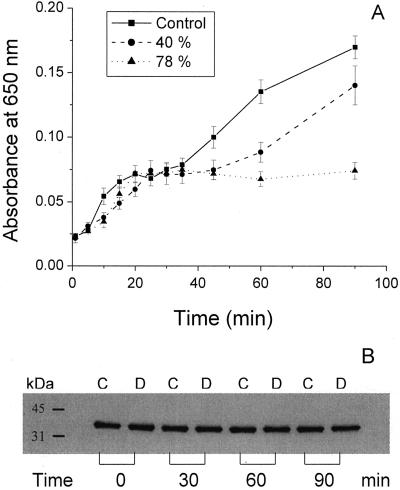
Figure 4.
A, Changes of the absorption values at 650 nm for control and 40%- and 78%-desiccated leaves. sds are shown by error bars. B, Immunoblot analysis of POR protein content for control (C) and 40%-desiccated (D) leaves, after 30, 60, and 90 min following the flash. Nonilluminated samples are indicated with 0 min.

