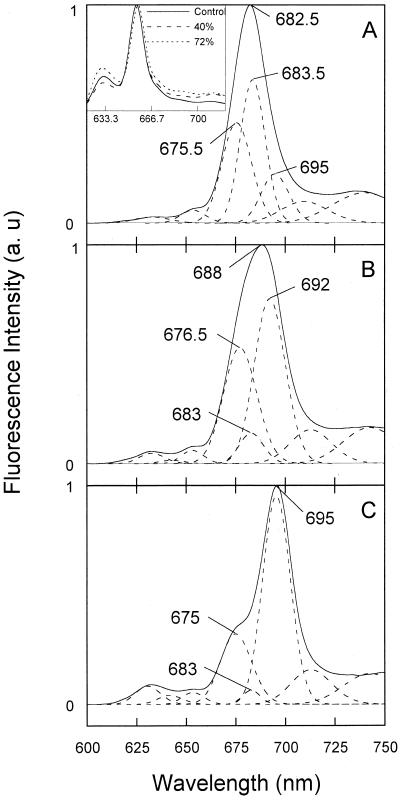
Figure 5.
Gaussian deconvolution of 77-K fluorescence-emission spectra 15 min after the flash. A, Control leaves. B, Forty percent-desiccated leaves. C, Seventy-four percent-desiccated leaves. The solid lines represent the experimental curves and the broken lines the Gaussian components of the deconvoluted spectra. Where necessary, the band positions are indicated. Inset, 77-K Fluorescence spectra of etiolated barley leaves before illumination and exposed to different levels of dehydration.

