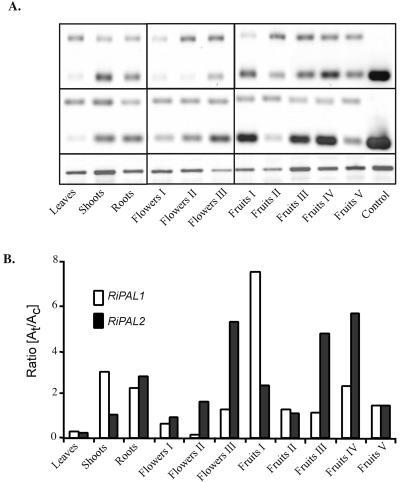
Figure 4.
Semiquantitative RT-cPCR estimation of the accumulation of specific RiPAL transcripts in different organs of raspberry. A, RT-cPCR was performed using 100 ng of total RNA isolated from: young leaves, shoots, roots, and different developmental stages of flowers and fruits. Following 32 cycles of amplification, the products (50% of each amplification mix) were resolved in a 3% (w/v) Tris-acetate-EDTA-agarose/ethidium bromide gel. B, The relative amounts of target (t; 217/218 bp) and competitor (c; 370 bp) amplification products were calculated, and the ratio of the two products graphed. Similar results were obtained in two independent experiments. The expression level of a given RiPAL gene can be compared between tissues, but expression of the two RiPAL genes cannot be compared within a tissue. The intensity of RiPAL bands was normalized to the intensity of the RiHis3 product (395 bp) as a control for equal amounts of starting RNA. No amplification products of this size were obtained in the absence of the RiHis3 primers. M, 100-bp DNA size marker; C, positive control cDNA.

