Table 3.
Performance metrics of the two AI models developed for analyzing panoramic radiographs. One model was designed for segmenting teeth, and the other for segmenting the cemento-enamel junction (CEJ) and alveolar bone levels. The models achieved the following scores (32).
| Teeth segmentation model | CEJ and bone level segmentation model | |
|---|---|---|
| Precision |
 0.80 |
 0.90 |
| F1 |
 0.80 |
 0.90 |
| Sensitivity |
 0.90 |
 1.0 |
| Specificity |
 0.96 |
 0.98 |
| Accuracy |
 0.97 |
 098 |
| mAP50 | 0.92 | 0.995 |
Accuracy: The overall percentage of correct predictions made by the AI model compared to the actual diagnosis.
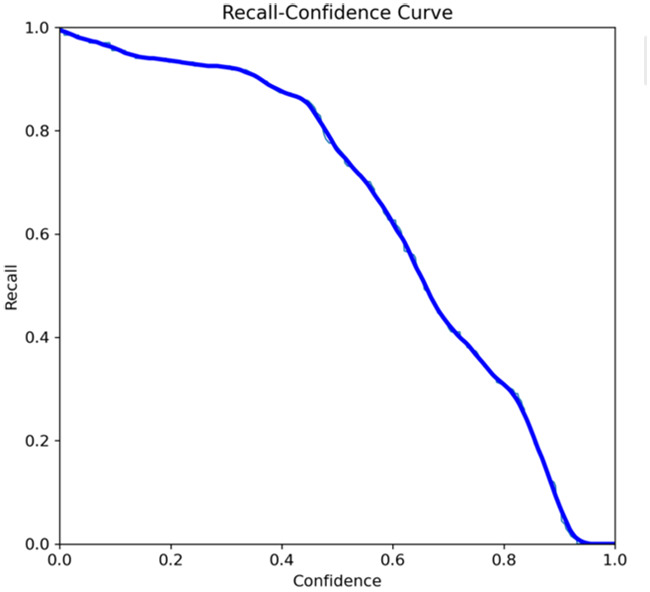
Sensitivity (Recall): The ability of the model to correctly identify cases of periodontal disease (true positives).
Specificity: The model's ability to correctly identify cases where periodontal disease is absent (true negatives).
Precision: The proportion of positive identifications that were actually correct.
F1 Score: The harmonic mean of precision and recall, providing a balance between them.
mAP50 (mean Average Precision at a 50% Intersection over Union threshold): A standard evaluation metric used in object detection tasks, such as the one used in the AI model for detecting periodontal disease.
