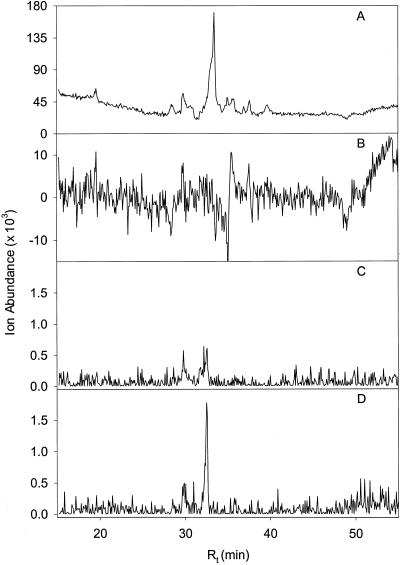
Figure 5.
LC-MS analysis of fosmidomycin-mediated perturbation of metabolite pools in isolated peppermint oil gland secretory cells. A, TIC of control cell extracts subtracted from TIC of extracts obtained from fosmidomicin-treated cells; B, EIC of control cells at m/z 213 [(M − H)−] for detection of DXP; C, EIC of fosmidomycin-treated cells {m/z 213 [(M − H)−] for DXP}. D, EIC of control cell extracts subtracted from EIC of fosmidomycin-treated cells to emphasize increase in DXP in fosmidomycin-treated cells.

