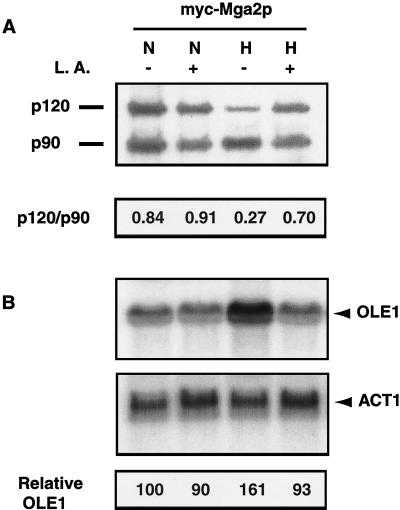
FIG. 9.
Hypoxia and UFA affect Mga2p processing and OLE1 expression. (A) Western blot assay. BY4741Δmga2 cells transformed with YEplac181-mycMGA2 containing a myc-MGA2 fragment (myc-Mga2p) were grown under different conditions. CEs were prepared as described in Materials and Methods after incubation of the yeast cells under normoxic (N) or hypoxic (H) conditions with (+) or without (−) 100 μM UFA (L.A.). At the bottom are p120/p90 ratios determined by densitometric measurement of p120 and p90 band densities. A Western blot assay was performed as described in Materials and Methods and probed with a monoclonal antibody to c-myc. (B) Northern blot assay. The positions of the OLE1 and ACT1 mRNAs are shown. At the bottom is a quantitative analysis of OLE1 mRNA expression in the Northern blot above. Signal intensity was quantitated with a Molecular Dynamics PhosphorImager. Transcript levels were normalized to the level of ACT1 mRNA and are presented as relative units with respect to the OLE1 mRNA extracted from strain BY4741Δmga2 transformed with YEplac181-mycMGA2 containing the myc-MGA2 fragment (Δmga2+MGA2) and grown without L.A. under normoxic conditions.

