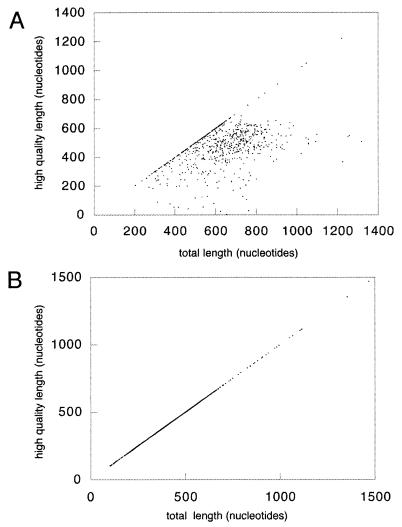
FIG. 2.
Quality versus length of GSS sequences. The plots represent high quality (Q20 > 15) length versus total length of the GSS sequences submitted to the public nucleotide database. (A) Sequences containing ORFs according to similarity search, annotated in the database entries using an mRNA feature. (B) Sequences with no mRNA feature were automatically cut at Q20 > 15 for database submission.

