Fig. 3.
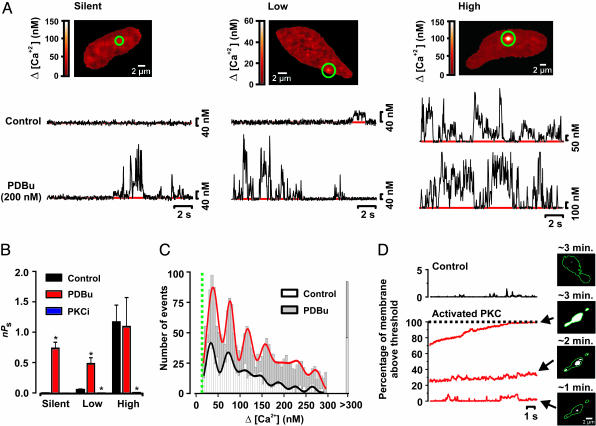
PKC induces persistent Ca2+ sparklet activity. (A) Images of cells with silent (Left), low (Center), and high (Left) nPs sites. Traces below each image show the time course of [Ca2+]i in the green circle before (Upper) and after PDBu (200 nM; Lower) treatment. (B) Mean ± SEM nPs of Ca2+ sparklet sites in control conditions and in the presence of PDBu or PKC inhibitory peptide (100 μM). (C) Amplitude histogram of Ca2+ sparklets in control conditions and in the presence of PDBu. Solid lines are the best fits to the data with the Gaussian function described in Fig. 1, using a q value of 38.7 nM (χ2 = 1.6) and 39.4 nM (χ2 = 2.9) for control (n = 779 events) and PDBu (n = 2247 events) data, respectively. (D) Sample traces of the fraction of the membrane with [Ca2+]i above threshold (resting [Ca2+] + 40 nM) in a control cell (Upper) and a cell dialyzed with activated PKC (Lower). [Ca2+]i was recorded ≈1, 2, or 3 min after gaining access into the cell interior. The images at Left were taken at the mentioned time points. The green line in the images outlines the cell.

