Abstract
A major goal of biomedical research is to develop the capability to provide highly personalized health care. To do so, it is necessary to understand the distribution of interindividual genetic variation at loci underlying physical characteristics, disease susceptibility, and response to treatment. Variation at these loci commonly exhibits geographic structuring and may contribute to phenotypic differences between groups. Thus, in some situations, it may be important to consider these groups separately. Membership in these groups is commonly inferred by use of a proxy such as place-of-origin or ethnic affiliation. These inferences are frequently weakened, however, by use of surrogates, such as skin color, for these proxies, the distribution of which bears little resemblance to the distribution of neutral genetic variation. Consequently, it has become increasingly controversial whether proxies are sufficient and accurate representations of groups inferred from neutral genetic variation. This raises three questions: how many data are required to identify population structure at a meaningful level of resolution, to what level can population structure be resolved, and do some proxies represent population structure accurately? We assayed 100 Alu insertion polymorphisms in a heterogeneous collection of ∼565 individuals, ∼200 of whom were also typed for 60 microsatellites. Stripped of identifying information, correct assignment to the continent of origin (Africa, Asia, or Europe) with a mean accuracy of at least 90% required a minimum of 60 Alu markers or microsatellites and reached 99%–100% when ⩾100 loci were used. Less accurate assignment (87%) to the appropriate genetic cluster was possible for a historically admixed sample from southern India. These results set a minimum for the number of markers that must be tested to make strong inferences about detecting population structure among Old World populations under ideal experimental conditions. We note that, whereas some proxies correspond crudely, if at all, to population structure, the heuristic value of others is much higher. This suggests that a more flexible framework is needed for making inferences about population structure and the utility of proxies.
Introduction
Eighty-five to ninety percent of neutral genetic variation in the human species is due to differences between individuals within populations (Lewontin 1972; Barbujani et al. 1997; Jorde et al. 2000). The remaining 10%–15% is distributed between groups, and, though modest, this variation influences the average differences in physical characteristics, disease susceptibility, and treatment outcome among populations (Gonzalez et al. 1999; Flanagan et al. 2000; Thio et al. 2002). To assess the impact of this variation, particularly in comparison with environmental factors, inferences are often made about the genetic structure of a sample (e.g., the number of subpopulations) and about which individuals are assigned to each subpopulation. This is important because it may be better to consider each subpopulation separately in some situations (e.g., testing whether the effects of natural selection or genetic drift differ between groups). Thus, a major goal of population genetics is to understand the nature and extent of human population structure.
Historically, proxies such as skin color, race, and ethnic label have been used to make inferences about population structure, even in the absence of corroborative genetic data (Cooper 1994; Laveist 1997; Williams 1997; Aspinall 1998). As a result, there is a large body of literature comparing phenotypes between cohorts defined, for example, as “blacks” and “whites.” In recent years, the validity of this classification scheme has been criticized for its weak conceptual underpinnings and its strong assumptions about underlying biology (Lee et al. 2001; Wilson et al. 2001; Foster and Sharp 2002). Given the growing availability of large collections of human genetic data from populations throughout the world, it was anticipated that the reliability of such proxies would be resolved via empirical testing (Mountain and Cavalli-Sforza 1997; Rannala and Mountain 1997; Shriver et al. 1997). Instead, recent, well-publicized studies have led to disparate and sometimes contradictory conclusions (Wilson et al. 2001; Risch et al. 2002). The result has been increased polarization about the nature of human population structure and a widespread belief that all commonly used proxies correspond poorly to genetically inferred clusters (Witzig 1996; Goodman 2000; Schwartz 2001). However, contrasting interpretations of the same set of data (Wilson et al. 2001) suggest that the signal from these data is too weak to justify such strong inferences (Risch et al. 2002).
To determine the amount of data needed to identify population structure and assign membership accurately, we used a data set of 60 microsatellites and 100 Alu insertion polymorphisms (hereafter referred to as “Alu markers”) to infer genetic clusters in a heterogeneous sample of >500 individuals from sub-Saharan Africa, East Asia, southern Asia, and Europe. We found that substantial genetic structure exists among samples from different continents, with samples from sub-Saharan Africa falling into two separate African-specific genetic clusters. Second, the geographic origin of individual samples, even from an admixed population, can be assigned with a moderate level of accuracy. Third, Alu markers and microsatellites have comparable power to detect population structure and assign origin, although accurate cluster assignment requires substantially more markers than have typically been tested. Fourth, the proxies associated with the samples used in this analysis were sometimes, though not always, sufficient representations of the inferred genetic clusters, reflecting the complex and interwoven history of the human species.
Material and Methods
Populations and Samples
For the power analysis, we genotyped 100 Alu polymorphisms and 60 tetranucleotide microsatellites in 206 individuals in 20 ethnic groups from sub-Saharan Africa (58), East Asia (67), and Europe (81). The Alu polymorphisms were also genotyped in 55 individuals from these groups who lacked microsatellite data, including 33 additional Mbuti pygmies from the Ituri forest, 41 sub-Saharan Africans from another three ethnic groups, and 263 individuals in various caste populations from the subcontinent of India. Thus, a total of 565 individuals from 23 ethnic groups and southern India were used in subsequent tests of sample assignment to inferred genetic clusters. (Details on the sample size of each ethnic group for the Alu data set are provided in fig. 4.)
Figure 4.
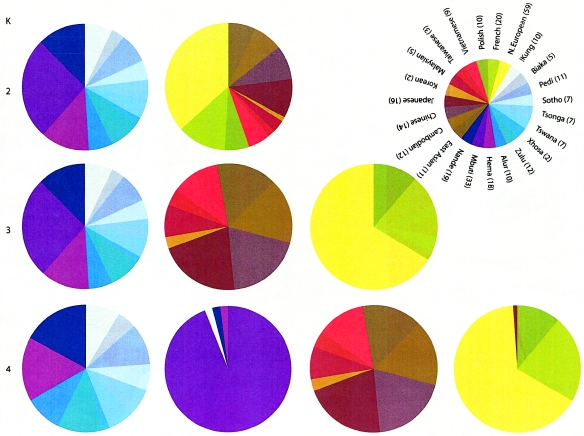
Assignment of samples from 23 ethnic groups from Africa, Asia, and Europe, to genetic clusters inferred from the analysis of 100 Alu insertion polymorphisms for K=2, 3, and 4. Sample sizes for each population are in parentheses.
Alu Insertion Polymorphisms and Microsatellites
All subjects were unrelated. Human-specific Alu polymorphisms were identified by comparing the human genome sequence data to sequences specific to Ya5, Yb8, Yb9, and Yc1 subfamilies, through use of the basic local alignment search tool (BLAST). Alu-specific primers were designed from flanking sequence and were tested for polymorphism in a panel of 20 African Americans, 20 Europeans, 20 Egyptians, and 20 natives of Greenland, as well as 1 gorilla, 1 chimpanzee, and 1 bonobo (Watkins et al. 2001). A subset of 100 autosomal, human-specific Alu markers were subsequently chosen for analysis. The specific identities of each Alu marker, the PCR conditions used to amplify each system, and the expected amplicon sizes can be found at W.S.W.'s Web site or under “publications” at M.A.B.'s Web site. Only samples for which ⩾90% of the data were complete (i.e., 206 samples) were used for the power calculations. A complete description of the microsatellites typed in each population has been published elsewhere (Jorde et al. 1995).
Structure Inference
After removing all information about the ethnic affiliation and continent of origin of each individual, we used a model-based clustering method implemented by the program Structure (version Jan. 2000; Pritchard Lab Web site) to estimate the number (K) of clusters into which the sample data (X) were fitted with posterior probability Pr(X|K), using a model with admixture and uncorrelated allele frequencies (Pritchard et al. 2000). A burn-in of 5,000 iterations was used. The estimate of K is dependent on the number of individuals that exist within subpopulations, the number of loci sampled, and the amount of differentiation between populations. Thus, K provides only a rough guide for determining which models may be consistent with the data. For K between 1 and 6, the posterior probability was equal to 1 for K=3 with Mbuti excluded or K=4 with the Mbuti included. Thus, for all power calculations and estimation of individual sample assignments, a K of 3 was used.
For each individual, Structure estimates the proportion of ancestry from each of the K clusters. A sample was considered assigned “correctly” if the cluster with the greatest proportion of ancestry was the same as the continent of origin of the sample. The probability of correct assignment with a given number of loci was estimated by use of a bootstrap procedure.
Bootstrapped estimates of 95% CIs were performed in four steps. First, a set of K random loci was chosen with replacement from the original data set, to form a simulated data set. Second, the simulated data set was analyzed using Structure software. Third, the mean coordinates of each population (sub-Saharan Africans, East Asians, and Europeans) were calculated. Fourth, the continent of origin of each individual was predicted as the continent with mean coordinates closest to the coordinates of that individual. The predicted continent of origin of the individual was then recorded. This procedure was bootstrapped 100 times for randomized data sets ranging in size from 1 to L loci, where L was the number of loci in the data set (100 for Alu markers, 60 for microsatellites, and 160 for Alu markers and microsatellites combined). In each replicate, the structure analysis was allowed to run for 100,000 iterations. Trial analyses showed that extending runs past 10,000 iterations had little effect on the results.
Estimates of FST were calculated using an infinite-alleles model as implemented in GDA (Lewis and Zaykin 2001; Lewis Lab Software Web site) for the Alu loci and using a stepwise mutation model for the microsatellites (Slatkin 1995).
Results
The Power to Detect Population Structure
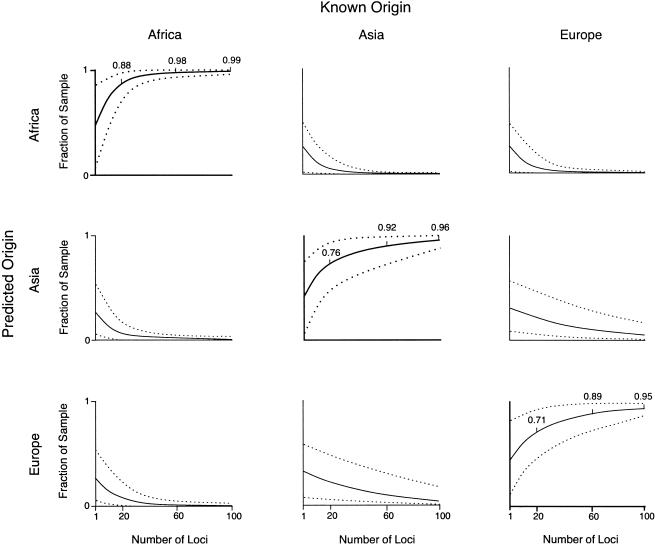
To determine the number of loci needed to detect population structure, we plotted the mean proportion of correct predictions of the continent of origin for n=1–L loci, where L was the number of loci in the data set (100 for Alu markers and 60 for microsatellites). The mean correct prediction of the continent of origin increased rapidly with the number of Alu or microsatellite loci used in the analysis. For the Alu data, the mean prediction rates ranged from 40%–50%, for one locus, to 95%–99%, for 100 loci, depending on the true population of origin (fig. 1). As additional loci were added, the rate of correct allocation increased more quickly for sub-Saharan Africans than for East Asians or Europeans. When only 20 markers were used, 88% of sub-Saharan Africans were assigned correctly, whereas correct assignment of either East Asians (76%) or Europeans (71%) was substantially less frequent. Sub-Saharan Africans were rarely allocated to Asia or Europe, and East Asians and Europeans were rarely predicted to originate from Africa. In contrast, East Asians and Europeans were interchanged >10% of the time, until >60 markers had been tested. Thus, for a given number of loci, it was easier, on average, to distinguish Africans from non-Africans than it was to distinguish between Europeans and East Asians.
Figure 1.
Predicted origin versus known origin for Africans, East Asians, and Europeans, estimated from 1–100 Alu insertion polymorphisms, bounded by 95% CIs.
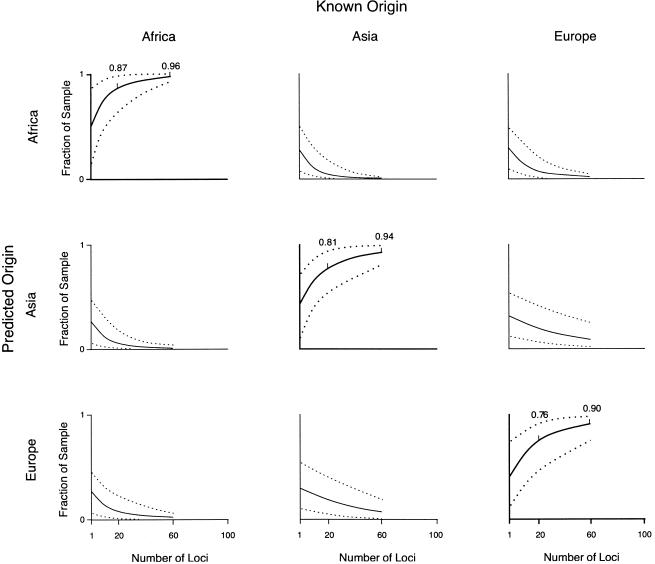
The power of microsatellites, on average, was approximately the same as the Alu markers for predicting the continent of origin for sub-Saharan Africans, East Asians, and Europeans (fig. 2), though it varied slightly, depending on the predicted origin. For example, 60 microsatellites were sufficient to correctly predict origin more often than the Alu loci for samples from East Asia and Europe. In contrast, 60 Alu loci were sufficient to correctly predict the origin of 98% of the sub-Saharan African sample on average, versus 96% for microsatellites. Because the higher mutation rate of microsatellites should lead to greater differentiation between populations, this result may seem counterintuitive. However, the higher mutation rate coupled with constraints on allele size lead to more homoplasy among microsatellite alleles. As a result, the power to detect differentiation among populations is reduced, because alleles may be identical by state but not by descent. In contrast, homoplasy and reversions are essentially nonexistent for Alu polymorphisms, so identity by descent is virtually assured (Batzer and Deininger 2002).
Figure 2.
Predicted origin versus known origin for Africans, East Asians, and Europeans, estimated from 1–60 microsatellite loci, bounded by 95% CIs.
The boundaries of the 95% CIs around the mean fraction of correct classification within each continent varied with both numbers of loci and geographic region. For instance, the CI around the mean correct prediction achieved with 100 Alu loci was very narrow in the sample from sub-Saharan Africa, indicating that the data are highly consistent in distinguishing sub-Saharan Africans from Europeans and East Asians. In contrast, the CIs around the mean correct prediction achieved with 100 Alu loci were broader in samples originating in East Asia and Europe, indicating that outcomes are more variable even with relatively large numbers of loci.
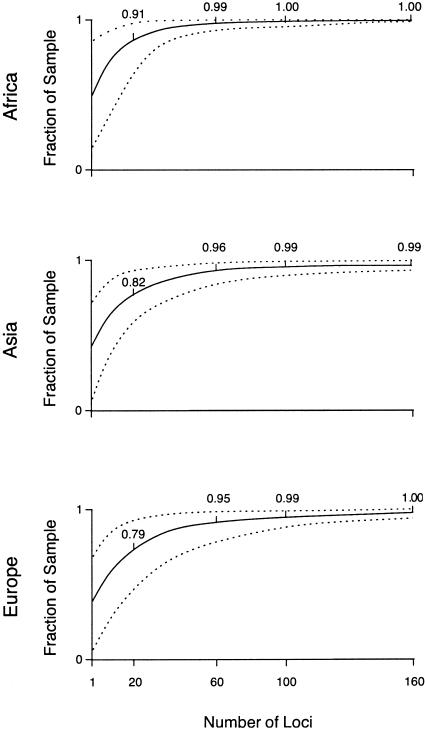
Combining the Alu and microsatellite data increased the power to correctly predict the continent of origin for the East Asian and European samples (fig. 3). For 20 loci, the mean correct prediction for the sub-Saharan African samples (91%) was highest, followed by those for the East Asians (82%) and the Europeans (79%). More than 95% of individuals could be assigned to their correct continent of origin with only 60 markers, and 160 markers enabled a mean correct prediction of 99%–100% for all samples. The 95% CIs around the mean fraction of placement within each continent were narrow for each geographical region, though they remained broader for East Asians and Europeans than for sub-Saharan Africans. If all the Alu or microsatellite loci were used without resampling, correct assignment to the continent of origin was 100%.
Figure 3.
Predicted origin vs. known origin for Africans, East Asians, and Europeans, estimated from 1–160 loci including both 100 Alu and 60 microsatellite loci, bounded by 95% CIs.
Assignment to Inferred Clusters
The assignment of samples from each of 23 different ethnic populations into genetically inferred clusters for K values of 2, 3, and 4 is illustrated in figure 4. For K=2, all of the samples from sub-Saharan Africa were grouped into one cluster, whereas all of the samples from Europe and East Asia were partitioned into the other. When a model of K=3 was used, the samples from sub-Saharan Africa remained in a separate cluster, but the samples from Europe and East Asia were divided into two clusters. Using K=4, population structure in the samples from sub-Saharan Africa becomes apparent. The samples from the Mbuti fall almost exclusively into a separate cluster, though three individuals from sub-Saharan African populations (one each from the Nande, Hema, and !Kung) were also included in this cluster. The Nande and Hema live on the borders of the Ituri forest, and both of the individuals assigned to the cluster with the Mbuti have either a Y chromosome or mitochondrial haplotype shared with the Mbuti, suggesting recent admixture (M.J.B., unpublished data). All of the samples from the Biaka, another population of Pygmies from sub-Saharan Africa distinct from the Mbuti, were assigned to the same cluster as most of the other sub-Saharan Africans. This is consistent with genetic data from classical markers suggesting they are admixed with other sub-Saharan African populations (Wijsman 1986).
These results indicate that the clustering properties of the Structure software were robust across the different values of K tested and that population structure and group membership could be inferred accurately, to varying levels of resolution. This is important because the resolution at which population structure needs to be detected can vary, depending on the hypothesis being tested (e.g., differences between sub-Saharan Africans and non-Africans vs. differences among populations within sub-Saharan Africa). In our case, population structure among samples from sub-Saharan Africa could be detected, though it only distinguished between samples from the Mbuti and non-Mbuti. The identification of a separate cluster of Mbuti was possible only when a relatively large sample from this population was included in the analysis (data not shown). These observations are consistent with simulations and empirical data indicating that population structure is more likely to be detected when a larger sample size of individuals is tested (Pritchard et al. 2000; Rosenberg et al. 2001).
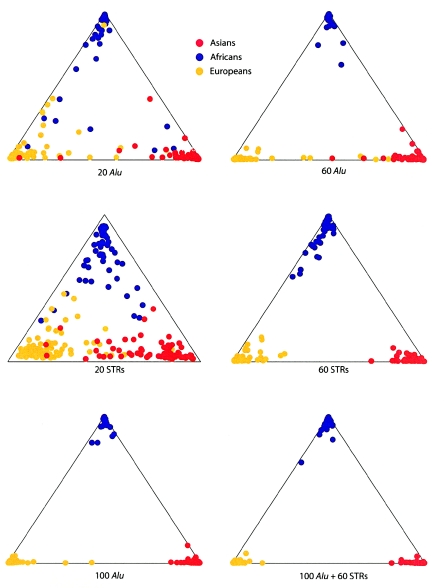
Despite the fact that we did not use the geographic origins of our samples in the analysis, the proportion of ancestry for each individual when K=3 broadly corresponded to the three geographic areas sampled (fig. 5). When either 20 microsatellites or Alu markers were used, there was considerable variance among the individual assignment probabilities, and it was higher for the Alu markers. However, the mean of the individual assignment probabilities was significantly higher for the Alu markers (mean ± SD = 0.866±0.20) than for the microsatellites (0.722±0.18) (P<.001 using Wilcoxon signed rank test). Increasing the number of markers to 60 improved the accuracy of assignment for both sets of data, with the mean probability of assignment increasing to 0.933±0.13 for 60 Alu markers and to 0.928±0.07 for 60 microsatellites. Thus, the accuracy of population assignment was comparable for both types of markers when a similar number of loci was used, although individual assignments were slightly more resolved with the Alu markers. When all 100 Alu markers were used, no individuals were misclassified (fig. 5). The mean and variance of the individual assignment probabilities did not differ substantially between continents.
Figure 5.
Proportion of ancestry for individual samples from Africa, Asia, and Europe for K=3, using 20, 60, and 100 Alu insertion polymorphisms; 20 and 60 microsatellite loci; and all 160 loci. The proportion of ancestry increases toward each apex.
The clustering algorithm implemented in Structure may merge subpopulations that share similar allele frequencies. Thus, the inference of population structure and assignment of samples to the correct population is expected to require substantially more information (i.e., more markers) for groups that have recently differentiated (e.g., Chinese and Japanese) or have experienced admixture (e.g., Afro-Caribbeans). To assess the power of the 100 Alu markers to detect structure and to assign origin correctly in such a situation, we genotyped samples from southern Indian caste groups and repeated the Structure analysis. On the basis of analyses of mtDNA, Y chromosome, and autosomal markers, we have inferred that these caste populations have received genetic contributions from multiple western Eurasian sources (Bamshad et al. 2001).
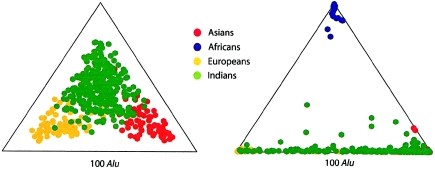
When the southern Indians were compared only to samples from Europe and East Asia, Structure found that the optimal number of genetic clusters was one. However, if we assumed that three clusters were present (i.e., K=3), as suggested by proxy information (i.e., place of origin), three groups were distinguished. Correct assignment of samples to their place of origin was 97% for samples from East Asia, 94% for samples from Europe, and 87% for samples from southern India (fig. 6). Thus, population assignment of individual samples was quite accurate even when the optimal number of clusters was one.
Figure 6.
Proportion of ancestry for individual samples from Asia, Europe, and India, for K=3, using 100 Alu loci (left), compared with the proportion of ancestry for individual samples from Africa, Asia, Europe, and India, for K=3, using 100 Alu loci (right). The proportion of ancestry increases toward each apex.
To test whether samples from India could be distinguished in an analysis of samples from all three continents, we added samples from Africa and reanalyzed the data. This time, the best estimate of K was 3, and the assignment to the correct population was ⩾98% for samples from sub-Saharan Africa, East Asia, and Europe. The samples from southern India were assigned predominantly to the cluster of East Asians (84%), though some of them (16%) were assigned to the cluster containing Europeans.
Discussion
We have demonstrated that, for a collection of heterogeneous samples from sub-Saharan Africa, East Asia, and Europe, the genetic data accurately predicted assignment to clusters that corresponded to major continents. However, correct assignment to the continent of origin with a mean accuracy of at least 90% required a minimum of ∼60 Alu markers or microsatellites. This is a modest number of markers, but it supports the contention that most studies performed to date have lacked the power to make strong inferences about population structure and sample assignment, even among highly differentiated samples (Wilson et al. 2001; Romualdi et al. 2002). When data from all 160 loci were used, the mean correct assignment to the continent of origin increased to 99%–100%.
The average probability of assignment of individual samples to the correct continent of origin was similar when the same number of Alu markers or microsatellites were used, although the performance of either set of markers varied among samples from different continents. It may be somewhat surprising that the Alu markers and microsatellites performed equally well. Because of their higher heterozygosity, polymorphic microsatellites are typically more informative for profiling individuals (Evett et al. 1996). However, the properties that make microsatellites useful for distinguishing among individuals are not necessarily the same as those that maximize the power of a locus to detect population structure and assign group membership.
To distinguish between two populations, the ideal locus is one for which an allele is fixed in one group but is absent in the other group (Reed 1973). In reality, such loci are rare in comparisons between continental populations. Instead, one criterion that has been used to rank the power of loci for detecting population structure is FST (Bowcock et al. 1991; Rosenberg et al. 2001). For some Alu markers, the insertion frequency varied little among continental populations, whereas others were nearly monomorphic in one continental population or another. Accordingly, the FST estimates of individual Alu loci ranged from 0 to 0.72 (see table A [online only]). Thus, although a minimum of 60 Alu markers or microsatellites was necessary to assign the predicted continent of origin for at least 90% of all samples, the individual markers were not equally informative.
Table A.
FST Estimates for Individual Alu Loci
| Locus | FST |
| ACE | .217367 |
| APO | .068328 |
| B65 | .044363 |
| Col3A1 | .135239 |
| HS2.43 | 0 |
| HS4.32 | .002158 |
| HS4.65 | .620348 |
| HS4.75 | .400165 |
| PV92 | .381469 |
| Sb19.12 | .265572 |
| Sb19.3 | .390778 |
| TPA25 | .170258 |
| Ya5NBC102 | .187268 |
| Ya5NBC120 | 0 |
| Ya5NBC123 | .175619 |
| Ya5NBC132 | .380505 |
| Ya5NBC135 | 0 |
| Ya5NBC147 | 0 |
| Ya5NBC148 | 0 |
| Ya5NBC150 | .507258 |
| Ya5NBC157 | .291865 |
| Ya5NBC159 | .374312 |
| Ya5NBC171 | 0 |
| Ya5NBC182 | .129715 |
| Ya5NBC208 | .097953 |
| Ya5NBC212 | .279153 |
| Ya5NBC216 | .025852 |
| Ya5NBC221 | .156919 |
| Ya5NBC237 | .417443 |
| Ya5NBC239 | .033228 |
| Ya5NBC241 | .316638 |
| Ya5NBC242 | .026242 |
| Ya5NBC27 | 0 |
| Ya5NBC311 | .017719 |
| Ya5NBC327 | .525477 |
| Ya5NBC333 | 0 |
| Ya5NBC335 | 0 |
| Ya5NBC345 | .13884 |
| Ya5NBC347 | .123956 |
| Ya5NBC351 | .209252 |
| Ya5NBC354 | .204459 |
| Ya5NBC45 | .534873 |
| Ya5NBC51 | .155227 |
| Ya5NBC54 | 0 |
| Ya5NBC61 | .019193 |
| Ya5NBC96 | 0 |
| Yb8NBC106 | .071623 |
| Yb8NBC120 | 0 |
| Yb8NBC125 | 0 |
| Yb8NBC13 | 0 |
| Yb8NBC146 | .055295 |
| Yb8NBC148 | .027613 |
| Yb8NBC157 | .208282 |
| Yb8NBC181 | .458031 |
| Yb8NBC192 | .002117 |
| Yb8NBC201 | 0 |
| Yb8NBC207 | 0 |
| Yb8NBC227 | .03482 |
| Yb8NBC237 | .308946 |
| Yb8NBC243 | .036548 |
| Yb8NBC405 | .095714 |
| Yb8NBC412 | .05522 |
| Yb8NBC419 | .207714 |
| Yb8NBC420 | 0 |
| Yb8NBC435 | .176905 |
| Yb8NBC437 | .222618 |
| Yb8NBC441 | .161456 |
| Yb8NBC450 | .392148 |
| Yb8NBC461 | 0 |
| Yb8NBC463 | .040165 |
| Yb8NBC466 | .31969 |
| Yb8NBC479 | .028366 |
| Yb8NBC480 | .241392 |
| Yb8NBC485 | .364764 |
| Yb8NBC49 | .224348 |
| Yb8NBC5 | .039874 |
| Yb8NBC505 | .22756 |
| Yb8NBC516 | .101917 |
| Yb8NBC547 | .230654 |
| Yb8NBC568 | .208751 |
| Yb8NBC576 | .14356 |
| Yb8NBC585 | .102977 |
| Yb8NBC589 | 0 |
| Yb8NBC596 | .163047 |
| Yb8NBC597 | .056774 |
| Yb8NBC598 | .035078 |
| Yb8NBC605 | .125513 |
| Yb8NBC622 | .03254 |
| Yb8NBC636 | .068834 |
| Yb8NBC65 | .118667 |
| Yb8NBC77 | .000215 |
| Yb8NBC80 | 0 |
| Yb8NBC93 | .170862 |
| Yb9NBC10 | .102712 |
| Yb9NBC50 | 0 |
| Yc1NBC2 | .004194 |
| Yc1NBC35 | .125644 |
| Yc1NBC53 | .247572 |
| Yc1NBC63 | .109183 |
| Yc1RG68 | .155734 |
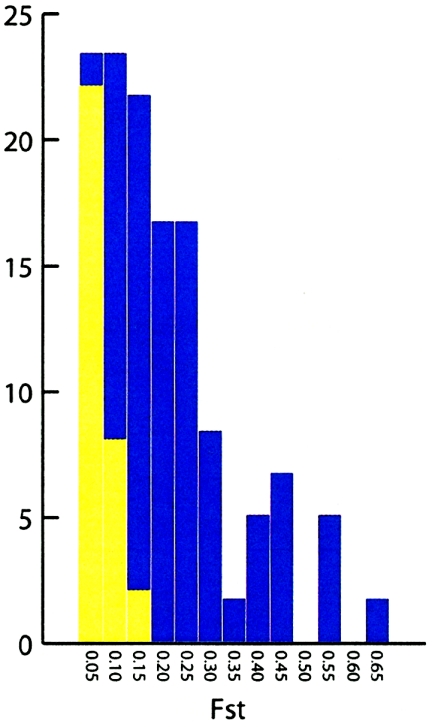
The FST value among the continental populations was markedly lower for microsatellites (0.042) than for Alu markers (0.13). The Alu FST value is consistent with FST estimates obtained in previous studies of diallelic markers. An analysis of 100 RFLPs yielded an FST value of 0.139 (Bowcock et al. 1991), and a study of 30 diallelic restriction-site polymorphisms obtained an FST value of 0.141 (Jorde et al. 2000). Similarly, the microsatellite FST value is somewhat lower than the previous estimates of 0.10 (Barbujani et al. 1997) and 0.086 (Pérez-Lezaun et al. 1997); this difference likely reflects the inclusion of Australian and New World samples in their analyses. The difference between the average FST values obtained for the Alu and microsatellite markers is an expected consequence of the elevated mutation rate of microsatellites, which lowers FST by increasing within-group variance relative to between-group variance (Jin and Chakraborty 1995). As expected, the distribution of FST estimates for individual microsatellites was skewed to the left compared with distribution for Alu markers (see fig. A [online only]). Yet, despite these differences, the statistical power of both types of markers was similar. This suggests that the power of individual loci is not only a function of FST.
Figure A.
Distribution of FST estimates among sub-Saharan Africans, East Asians, and Europeans, for each Alu marker (blue) and each microsatellite locus (yellow).
A variety of other criteria have been employed to rank the power of markers for estimating individual assignment probabilities. Markers for making admixture estimates in individuals have been ranked by estimating the maximal differences in allele frequencies between the ancestral populations (Shriver et al. 1997). The expected heterozygosity or number of alleles at a locus also appears to correspond to the power of individual loci to detect population clusters (Rosenberg et al. 2001). The total heterozygosity of each microsatellite locus used in this analysis (typically >0.70) exceeds the heterozygosity of each Alu marker (maximum of 0.50), and, although many of the alleles at each microsatellite locus were found at a similar frequency in each continental population, the distribution of other alleles was more restricted. Thus, although the microsatellites may have had low FST estimates, they were still powerful for estimating population structure and assigning group membership probabilities. This suggests that the power of each marker is a function of a combination of the number of alleles, heterozygosity, and FST. Accordingly, the minimum amount of genetic data required to accurately infer population structure will vary with the power of each marker as well as the number of markers used, and therefore careful consideration of the choice of marker can improve statistical power.
In our analysis, 100 Alu markers did not provide enough information to distinguish samples from a southern Indian population as a separate cluster among sub-Saharan Africans, East Asians, and Europeans. As a consequence, when K=3, 84% and 16% of the samples from India were assigned to genetically inferred clusters from East Asia and Europe, respectively. However, if we assumed that origin on the subcontinent of India was an accurate proxy and used K=4, the percentage of southern Indians assigned to a separate cluster was 87%. This result suggests that information on the demographic and evolutionary history of a population is needed to determine whether a proxy can be used to more accurately infer population structure.
In previous studies of human population structure, samples from several admixed populations defined by proxy (e.g., Ethiopian, Afro-Caribbean) were assigned to two or more genetically inferred clusters (Wilson et al. 2001; Romualdi et al. 2002). This was interpreted as evidence that proxies inaccurately reflect population structure. The results of our analysis indicate that the resolution at which human population structure can be detected is dependent on the number of loci tested, the amount of differentiation among populations, the sample size of each population, and the attempted level of resolution of population structure. Thus, only weak inferences can be drawn from the failure to detect population structure when a small number of genetic markers or a small sample size of individuals is used.
Our analysis is based on samples from regions of Africa, Asia, and Europe that are widely separated from one another. Accordingly, these samples also maximize the degree of genetic variation among populations. The performance (and, hence, the power) of these markers to differentiate among populations from these continents would be reduced if samples were included from regions geographically intermediate between the regions sampled here (e.g., the Middle East, Central Asia). Indeed, detection of population structure and assignment of samples to the correct genetically inferred cluster was less accurate for samples from geographically intermediate southern India. Importantly, the inclusion of such samples demonstrates geographic continuity in the distribution of genetic variation and thus undermines traditional concepts of race. The results of our power calculations, however, are important because they set a minimum for the number of markers that must be tested to make strong inferences about detecting population structure when groups are widely dispersed.
Group membership has commonly been assigned by place of birth (e.g., Africa, Japan), religious belief (e.g., Amish, Jewish, Hindu), language (e.g., Amerind, Khoisan), or physical traits (e.g., skin color). These proxies vary in the extent to which they reflect demographic trends or evolutionary forces that affect the distribution of neutral genetic variation. As a result, the concordance of each of these proxies to population structure inferred from neutral genetic data also varies. For example, an ethnic label such as “Mbuti” is an accurate guide to population structure, because it delimits a group that has differentiated from others as a result of reproductive isolation and genetic drift. In contrast, a proxy such as skin color is inaccurate, because it delimits a group (e.g., sub-Saharan Africans, New Guinea highlanders, and Australian aborigines) whose members are similar, vis-a-vis this trait, as a result of convergent natural selection. The situation is likely to be similar at many loci influencing disease susceptibility or drug response, highlighting the need to base inferences of population assignment on explicit genetic information. However, there are also notable examples in which disease alleles closely parallel population boundaries defined by a proxy (Splawski et al. 2002). A more balanced interpretation of human population genetics data is that a proxy is sometimes, but not always, an accurate guide to population structure.
Note added in proof.—Rosenberg and colleagues recently (2002) published an analysis of global patterns of human population structure using 400 microsatellites. They found that there is substantial geographic structure among populations, although the proportion of an indivudal's ancestry from one or more populations was highly variable.
Acknowledgments
This research was supported by National Institutes of Health grants GM-59290 and RR-00064, Louisiana Board of Regents Millennium Trust Health Excellence Fund HEF (2000-05)-05, (2000-05)-01, (2001-06)-02, and National Science Foundation grants SBR-9514733, SBR-9818215, BCS-0218338, and BCS-0218370. We thank Phil Fischer, Trefor Jenkins, Ken and Judy Kidd, and Himla Soodyall, for some of the DNA samples; and Alan Rogers and two anonymous reviewers, for a critical review of the manuscript.
Electronic-Database Information
Accession numbers and URLs for data presented herein are as follows:
- Lewis Lab Software, http://lewis.eeb.uconn.edu/lewishome/software.html (for Genetic Data Analysis [GDA], the software used to estimate FST statistics)
- M.A.B.'s Web site, http://batzerlab.lsu.edu/ (for the specific identities of each Alu marker, the PCR conditions used to amplify each system, and the expected amplicon sizes)
- Pritchard Lab, http://pritch.bsd.uchicago.edu/ (for Structure, the software used to detect population structure and make inferences about population assignment)
- W.S.W.'s Web site, http://www.genetics.utah.edu/~swatkins/pub/Alu_data.htm (for the specific identities of each Alu marker, the PCR conditions used to amplify each system, and the expected amplicon sizes)
References
- Aspinall PJ (1998) Describing the “white” ethnic group and its composition in medical research. Soc Sci Med 47:1797–1808 [DOI] [PubMed] [Google Scholar]
- Bamshad M, Kivisild T, Watkins WS, Dixon ME, Ricker CE, Rao BB, Naidu JM, Prasad BV, Reddy PG, Rasanayagam A, Papiha SS, Villems R, Redd AJ, Hammer MF, Nguyen SV, Carroll ML, Batzer MA, Jorde LB (2001) Genetic evidence on the origins of Indian caste populations. Genome Res 11:994–1004 [DOI] [PMC free article] [PubMed] [Google Scholar]
- Barbujani G, Magagni A, Minch E, Cavalli-Sforza LL (1997) An apportionment of human DNA diversity. Proc Nat Acad Sci USA 94:4516–4519 [DOI] [PMC free article] [PubMed] [Google Scholar]
- Batzer MA, Deininger PL (2002) Alu repeats and human genomic diversity. Nat Rev Genet 3:370–379 [DOI] [PubMed] [Google Scholar]
- Bowcock AM, Kidd JR, Mountain JL, Hebert JM, Carotenuto L, Kidd KK, Cavalli-Sforza LL (1991) Drift, admixture, and selection in human evolution: a study with DNA polymorphisms. Proc Natl Acad Sci USA 88:3839–3343 [DOI] [PMC free article] [PubMed] [Google Scholar]
- Cooper RS (1994) A case study in the use of race and ethnicity in public health surveillance. Public Health Rep 109:46–52 [PMC free article] [PubMed] [Google Scholar]
- Evett IW, Gill PD, Scrange JK, Weir BS (1996) Establishing the robustness of short-tandem-repeat statistics for forensic applications. Am J Hum Genet 58:398–407 [PMC free article] [PubMed] [Google Scholar]
- Flanagan N, Healy E, Ray A, Philips S, Todd C, Jackson IJ, Birch-Machin MA, Rees JL (2000) Pleiotropic effects of the melanocortin 1 receptor (MC1R) gene on human pigmentation. Hum Mol Genet 9:2531–2537 [DOI] [PubMed] [Google Scholar]
- Foster JW, Sharp RR (2002) Race, ethnicity, and genomics: social classifications as proxies of biological heterogeneity. Genome Res 12:844–850 [DOI] [PubMed] [Google Scholar]
- Gonzalez E, Bamshad M, Sato N, Mummidi S, Dhanda R, Catano G, Cabrera S, McBride M, Cao XH, Merrill G, O'Connell P, Bowden DW, Freedman BI, Anderson SA, Walter EA, Evans JS, Stephan KT, Clark RA, Tyagi S, Ahuja SS, Dolan MJ, Ahuja SK (1999) Race-specific HIV-1 disease-modifying effects of CCR5 haplotypes. Proc Nat Acad Sci USA 96:12004–12009 [DOI] [PMC free article] [PubMed] [Google Scholar]
- Goodman AH (2000) Why genes don’t count (for racial differences in health). Am J Public Health 90:1699–1702 [DOI] [PMC free article] [PubMed] [Google Scholar]
- Jin L, Chakraborty R (1995) Population structure, stepwise mutations, heterozygote deficiency and their implications in DNA forensics. Heredity 74:274–285 [DOI] [PubMed] [Google Scholar]
- Jorde LB, Bamshad MJ, Watkins WS, Zenger R, Fraley AE, Krakowiak PA, Carpenter KD, Soodyall H, Jenkins T, Rogers AR (1995) Origins and affinities of modern humans: a comparison of mitochondrial and nuclear genetic data. Am J Hum Genet 57:523–538 [DOI] [PMC free article] [PubMed] [Google Scholar]
- Jorde LB, Watkins WS, Bamshad MJ, Dixon ME, Ricker CE, Seielstad MT, Batzer MA (2000) The distribution of human genetic diversity: a comparison of mitochondrial, autosomal, and Y chromosome data. Am J Hum Genet 66:979–988 [DOI] [PMC free article] [PubMed] [Google Scholar]
- LaVeist TA (1996) Why we should continue to study race…but do a better job: an essay on race, racism, and health. Ethn Dis 6:21–29 [PubMed] [Google Scholar]
- Lee SS, Mountain J, Koenig BA (2001) The meanings of “race” in the new genomics: implications for health disparities research. Yale J Health Pol Law Ethics 1:33–71 [PubMed] [Google Scholar]
- Lewis PO, Zaykin D (2001) Genetic data analysis: computer program for the analysis of allelic data. Release 1.0. Department of Ecology and Evolution, University of Connecticut [Google Scholar]
- Lewontin RC (1972) The apportionment of human diversity. Evol Biol 6:381–398 [Google Scholar]
- Mountain JL, Cavalli-Sforza LL (1997) Multilocus genotypes, a tree of individuals, and human evolutionary history. Am J Hum Genet 61:705–718 [DOI] [PMC free article] [PubMed] [Google Scholar]
- Perez-Lezaun A, Calafell F, Mateu E, Comas D, Ruiz-Pacheco R, Bertranpetit J (1997) Microsatellite variation and the differentiation of modern humans. Hum Genet 99:1–7 [DOI] [PubMed] [Google Scholar]
- Pritchard JK, Stephens M, Donnelly P (2000) Inference of population structure using multilocus genotype data. Genetics 155:945–959 [DOI] [PMC free article] [PubMed] [Google Scholar]
- Rannala B, Mountain JL (1997) Detecting immigration by using multilocus genotypes. Proc Natl Acad Sci USA 94:9197–9201 [DOI] [PMC free article] [PubMed] [Google Scholar]
- Reed TE (1973) Number of gene loci required for accurate estimation of ancestral population proportions in individual human hybrids. Nature 244:575–576 [DOI] [PubMed] [Google Scholar]
- Risch N, Burchard E, Ziv E, Tang H (2002) Categorization of humans in biomedical research: genes, race and disease. Genome Biol 3:1–12 [DOI] [PMC free article] [PubMed] [Google Scholar]
- Romualdi C, Balding D, Nasidze IS, Risch G, Robichaux M, Sherry ST, Stoneking M, Batzer MA, Barbujani G (2002) Patterns of human diversity, within and among continents, inferred from biallelic DNA polymorphisms. Genome Res 12:602–612 [DOI] [PMC free article] [PubMed] [Google Scholar]
- Rosenberg NA, Burke T, Elo K, Feldman MW, Freidlin PJ, Groenen MA, Hillel J, Maki-Tanila A, Tixier-Boichard M, Vignal A, Wimmers K, Weigend S (2001) Empirical evaluation of genetic clustering methods using multilocus genotypes from 20 chicken breeds. Genetics 159:699–713 [DOI] [PMC free article] [PubMed] [Google Scholar]
- Rosenberg NA, Pritchard JK, Weber JL, Cann HM, Kidd KK, Zhivotovsky LA, Feldman MW (2002) Genetic structure of human populations. Science 298:2381–2385 [DOI] [PubMed] [Google Scholar]
- Schwartz RS (2001) Racial profiling in medial research. N Engl J Med 344:1392–1393 [DOI] [PubMed] [Google Scholar]
- Shriver MD, Smith MW, Jin L, Marcini A, Akey JM, Deka R, Ferrell R (1997) Ethnic-affiliation estimation by use of population-specific DNA markers. Am J Hum Genet 60:957–964 [PMC free article] [PubMed] [Google Scholar]
- Slatkin M (1995) A measure of population subdivision based on microsatellite allele frequencies. Genetics 139:457–462 [DOI] [PMC free article] [PubMed] [Google Scholar]
- Splawski I, Timothy KW, Tateyama M, Clancy CE, Malhotra A, Beggs AH, Cappuccio FP, Sagnella GA, Kass RS, Keating MT (2002) Variant of SCN5A sodium channel implicated in risk of cardiac arrhythmia. Science 297:1333–1336 [DOI] [PubMed] [Google Scholar]
- Thio CL, Thomas DL, Goedert JJ, Vlahov D, Nelson KE, Hilgartner MW, O'Brien SJ, Karacki P, Marti D, Astemborski J, Carrington M (2002) Racial differences in HLA class II associations with hepatitis C virus outcomes. J Infect Dis 184:16–21 [DOI] [PubMed] [Google Scholar]
- Watkins WS, Ricker CE, Bamshad MJ, Carroll ML, Nguyen SV, Batzer MA, Harpending HC, Rogers AR, Jorde LB (2001) Patterns of ancestral human diversity: an analysis of Alu-insertion and restriction-site polymorphisms. Am J Hum Genet 68:738–752 [DOI] [PMC free article] [PubMed] [Google Scholar]
- Wijsman EM (1986) Estimation of genetic admixture in Pygmies. In: Cavalli-Sforza LL (ed) African pygmies. Academic Press, Orlando, pp 347–358 [Google Scholar]
- Williams DR (1997) Race and health: basic questions, emerging directions. Ann Epidemiol 7:322–333 [DOI] [PubMed] [Google Scholar]
- Wilson JF, Weale ME, Smith AC, Gratrix F, Fletcher B, Thomas MG, Bradman N, Goldstein DB (2001) Population genetic structure of variable drug response. Nat Genet 29:265–269 [DOI] [PubMed] [Google Scholar]
- Witzig R (1996) The medicalization of race: scientific legitimization of a flawed social construct. Ann Intern Med 125:675–679 [DOI] [PubMed] [Google Scholar]


