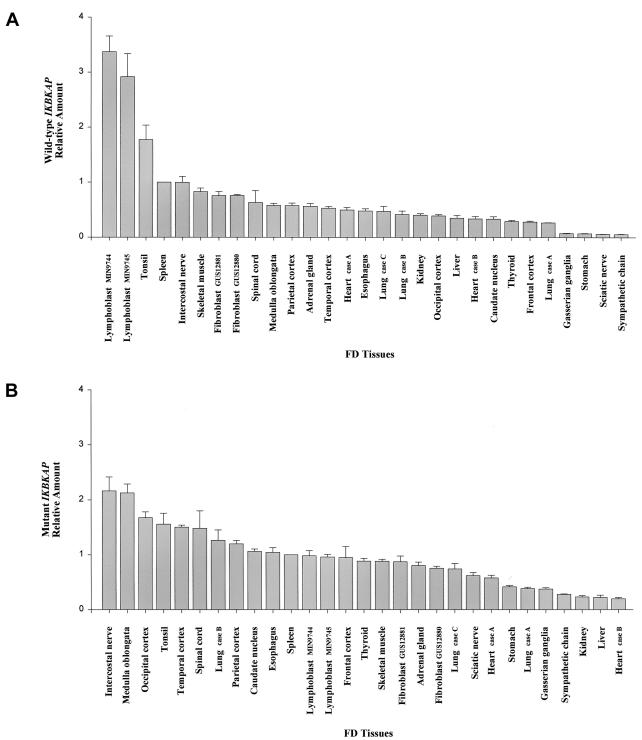
Figure 3.
Graphical representation of relative WT and MU IKBKAP expression levels in various FD postmortem tissues and cultured cell lines, measured by use of real-time QPCR. The QPCR values were normalized using 18S rRNA, and the spleen tissue was used as the calibrator for relative comparisons between patient samples. A, Relative WT IKBKAP levels. The FD lymphoblast cell lines followed by the tonsil tissue showed relatively higher levels of WT message than any other patient tissues examined. B, Relative mutant IKBKAP levels. Several areas of the neocortex, as well as the brain stem medulla, striatum (caudate nucleus), spinal cord, and intercostal nerve tissue samples, showed relatively higher levels of the MU IKBKAP transcript compared with other patient tissues and cell lines investigated. Among the nonnervous tissues tested, only the tonsil, esophagus, and one of the lung samples (case B) showed relatively high MU IKBKAP levels, whereas the others had intermediate levels.

