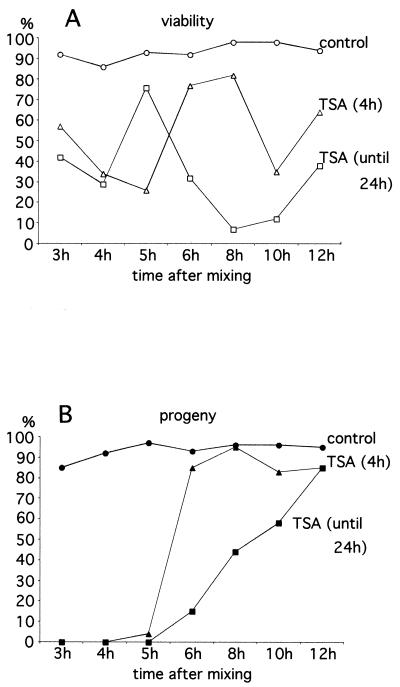
FIG. 2.
Genetic analysis of the effects of TSA treatment during conjugation. TSA was added to mating cells at various times (beginning at 3 h and continuing until 12 h after mixing) as indicated in the abscises in both graphs (A and B). The treatment was either for 4 h (triangles) or continued until 24 h after mixing (squares). Control samples are represented by circles. After treatment, individual mating pairs were cloned and the percentages of pairs giving viable cells were scored (A). The percentages of mating pairs that successfully produced sexual progeny (see Materials and Methods) are also given (B). The number of cells analyzed for each point was between 88 and 352. The results are the combined totals of two or more experiments. The discrepancy in the percentage of viability between the 4-h treatment (low viability) and the treatment until 24 h (high viability) for cells treated at 5 h after mixing may be due to bias introduced during cell cloning. At 24 h, many dying or dead cells were already immobile and thus not cloned, which raised the percentage of viable cells among those cloned.

