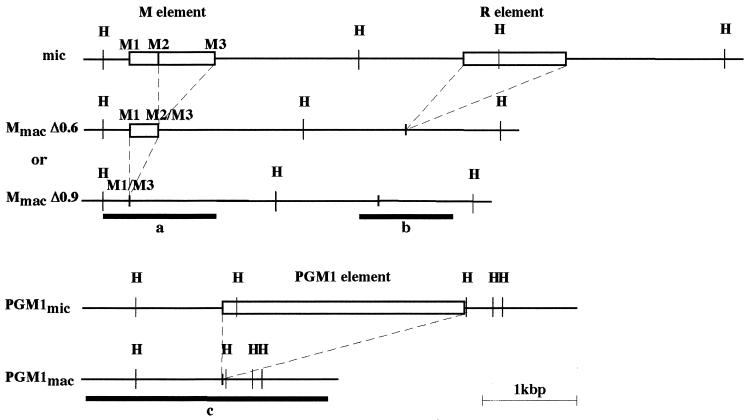
FIG. 3.
Maps of the micronuclear and macronuclear versions of the genomic region containing the M and R elements (top panel) and of the genomic region containing the PGM1 element (bottom panel). Micronuclear specific elements are represented by open boxes. The M element is excised from the micronuclear genome in two alternative forms of 0.6kbp (MmacΔ0.6) and 0.9 kbp (MmacΔ0.9). The positions and lengths of probes a, b, and c are shown. HindIII (H) restriction sites are indicated.

