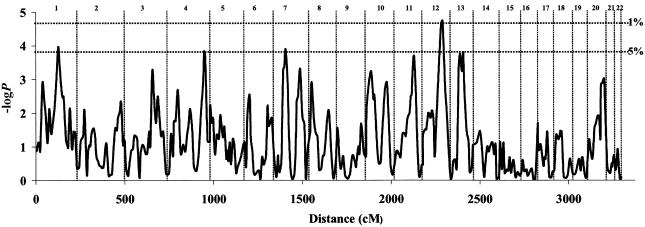
Figure 2.
Multipoint linkage analysis of the genome for individual variation in neuroticism. The −logP values (vertical axis) for the Visscher-Hopper regression are shown (Visscher and Hopper 2001). The cumulative distance is given at the bottom, and chromosome numbers are given at the top. The two dotted, horizontal lines represent the empirically derived genomewide significance thresholds (5% and 1%).

