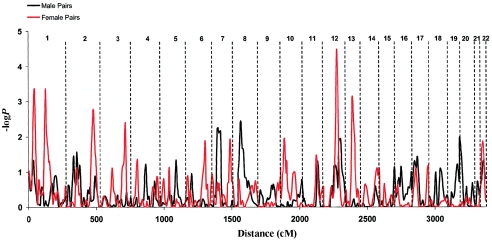
Figure 4.
Genomewide linkage analysis for individual variation in neuroticism in female-female (red line) and male-male (black line) sibling pairs. The −logP values (vertical axis) for the Visscher-Hopper regression are shown (Visscher and Hopper 2001). The cumulative distance is displayed at the bottom, and chromosome numbers are given at the top.

