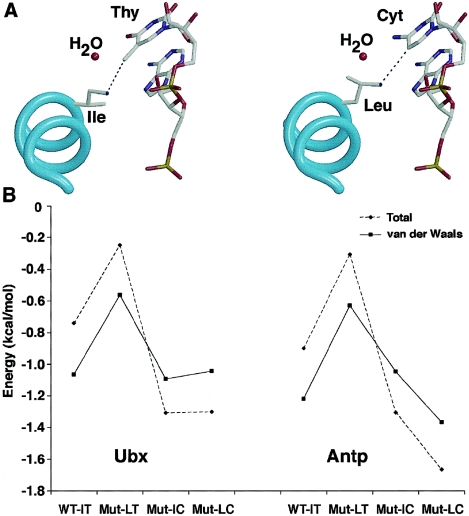
Figure 7.
Interaction between HOXD13 and DNA sequences. A, Models based on the Ubx/DNA complex, highlighting the interaction between Ile and thymine (Thy) in the wild type (left panel) and between Leu and cytosine (Cyt) in the “double mutant” (right panel). The cyan spiral indicates the main chain of homeodomain helix III; atoms (except H) in the position 47 side chain and DNA are color coded as follows: C = gray; O = red; N = dark blue; P = orange. B, Total (dashed line) and van der Waals (solid line) interaction energies (in kcal/mol) between Ile and Thy (WT-IT, wild type), Leu and Thy (Mut-LT, Ile→Leu mutant), Ile and Cyt (Mut-IC, Thy→Cyt mutant), and Leu and Cyt (Mut-LC, double mutant). Models were built using the Ubx (left) and Antp (right) homeodomain/DNA complexes.

