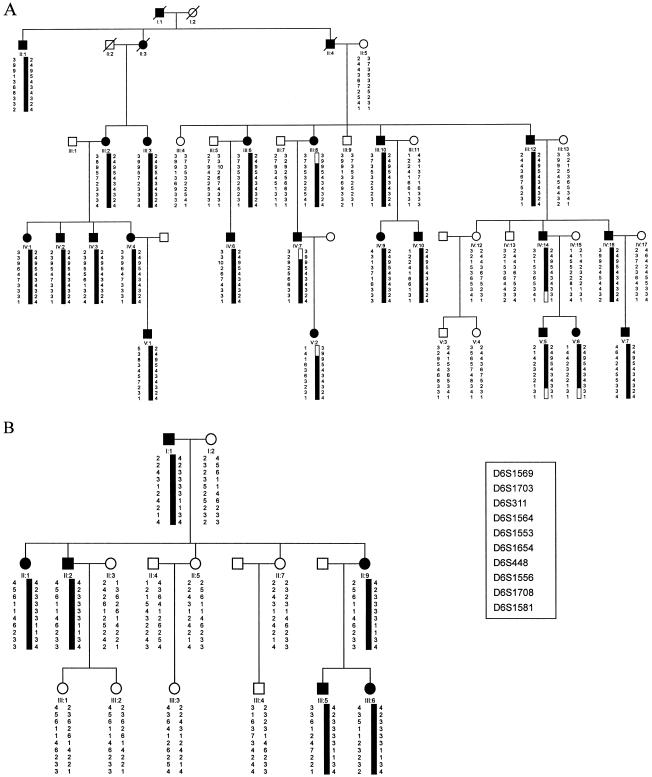
Figure 1.
Pedigree structure and haplotypes of family A (A) and family B (B). Marker order was determined from the Généthon sex-averaged genetic map, the CHLC sex-averaged genetic map, and the Genome Database. Open symbols indicate unaffected individuals, blackened symbols indicate affected individuals, squares indicate men, and circles indicate women. Blackened bars indicate the chromosome region shared by affected members of the pedigree.

