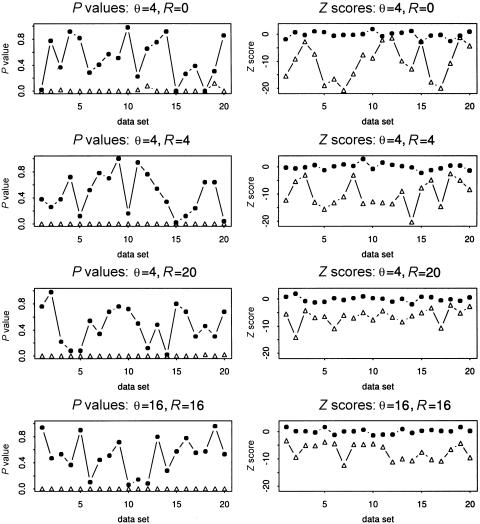
Figure 1.
The P values and Z scores for 40 sets of genotypes with (θ,R)=(4,0), (4,4), (4,20) and (16,16). The dotted lines are for the data sets in which there are interactions between two haplotype blocks, and the lines with small triangles are for the data sets in which there are no interactions between the two haplotype blocks.

