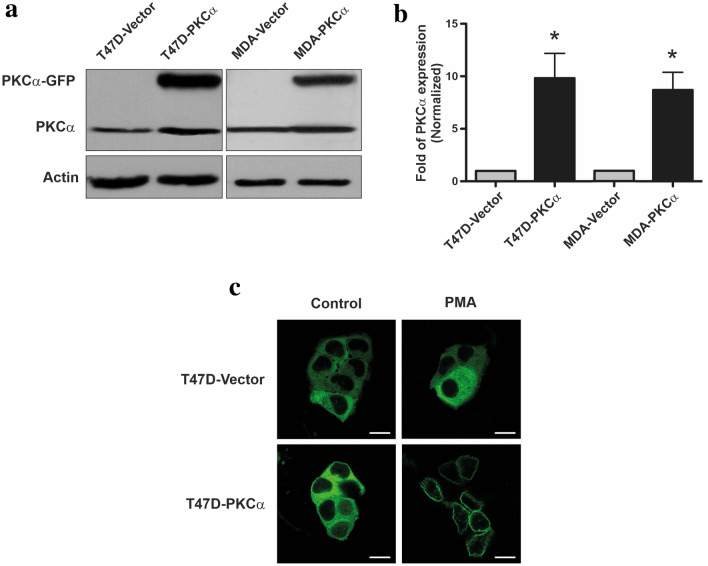
Fig. 1.
Overexpression of PKCα in T47D and MDA-MB231 cells. a Whole cell lysates prepared from T47D and MDA-MB231 cells transfected with pGFPN1-PKCα or pGFPN1 (vector alone) were resolved on 10% SDS-PAGE and blotted with an anti-PKCα antibody (50 μg protein/lane). b Densitometric analysis of PKC overexpression. Results were expressed in fold of PKCα expression relative to vector-transfected cells expression. Each data point represents the mean ± S.D. three independent experiments. *p < 0.05 versus the respective vector-transfected cell line (ANOVA test). c T47D cells transfected with pGFPN1-PKCα or pGFPN1 vector alone were incubated with PMA (50 nM) for 10 min, fixed and PKCα-GFP localization was analyzed by confocal microscope (scale bar: 50 μm). Results are representative of three independent experiments

