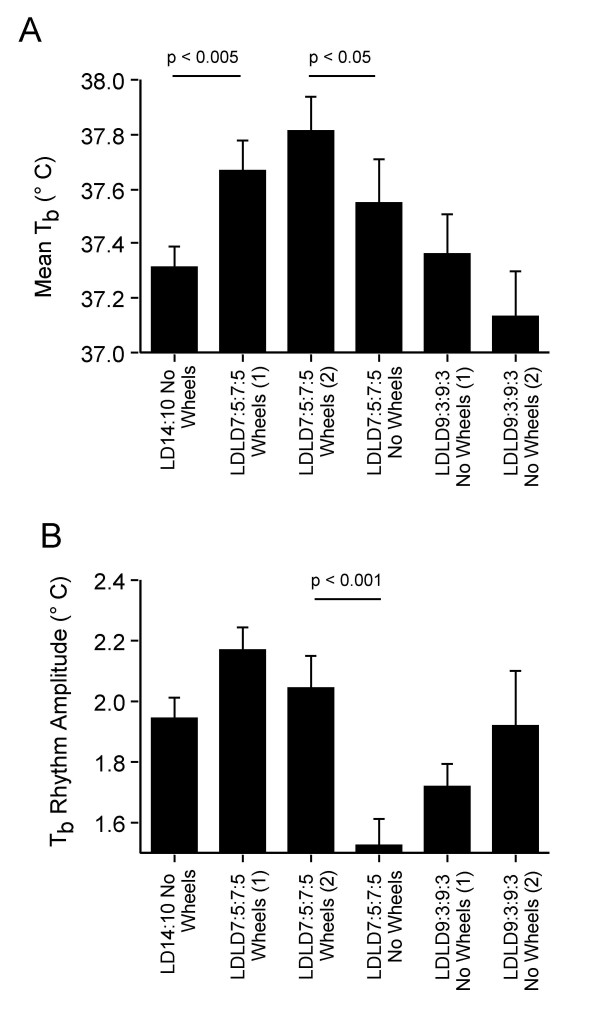
Figure 2.

Mean (± SEM) (A) and amplitude (± SEM) (B) of the Tb rhythm over each of the intervals throughout the experiment. Illustrated are data from 12 hamsters with continuously functioning telemeters, analyzed with repeated measures ANOVA. In some cases (LDLD7:5:7:5 with wheels; LDLD9:3:9:3 without wheels) conditions persisted for several weeks allowing values to be calculated over two intervals separated by cage changes. Means of group pairs below lines with P values differ significantly by paired t-test after correction for multiple comparisons.
