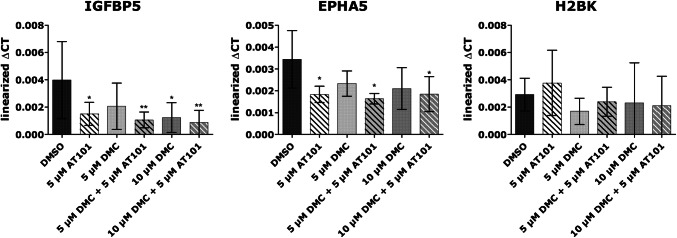
Fig. 4.
Expression of IGFB5, EPHA5, and H2BK in PC 1 after 6 days of stimulation. Cells were either treated with 5 µM AT101, 5 or 10 µM DMC as well as the combination of 5 or 10 µM DMC plus 5 µM AT101 for up to 6 days and analyzed by qRT-PCR regarding the mRNA expression of IGFBP5, EphA5 and H2BK. Linearized ΔCT values were depicted of n = 5 independent experiments. A repeated one-way ANOVA followed by a Bonferroni’s multiple comparison test, comparing each column to all the other columns, of the linearized ΔCT was performed to check significant differences. Only significances between the different stimulations and DMSO, and between the combined treatment to their respective single treatments are depicted (*p < 0.05, **p < 0.01, ***p < 0.001)

