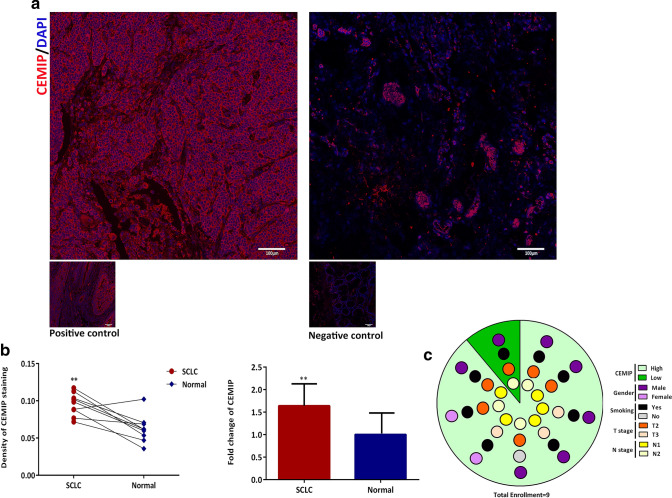
Fig. 1.
Expression of CEMIP on SCLC patients. a Left confocal image showed protein expression of CEMIP on SCLC tissue slice which was stained in red, and the nuclei was stained by DAPI as in blue color, whereas the right picture showed its pair normal counterpart. The positive and negative control of CEMIP staining, correspond to colon tumor tissue and its adjacent normal tissue, was placed in the down left of each pictures respectively. b Fluorescence density of CEMIP staining for SCLC and paired adjacent normal tissue was matched after statistic analysis wherein expression of CEMIP on SCLC with 1.64 ± 0.64 fold higher than that on paired normal, shown as in bar chart. c Demographic characteristics of enrolled patients. Background of the pie chart presented the expression level of CEMIP, each rounds with different color in each parallel cycles indicated the gender, smoking statue, T stage and N stage, respectively. p value ≤ 0.05 remains statistic significance, ***p value ≤ 0.001, **p value ≤ 0.01

