
Fig. 5.
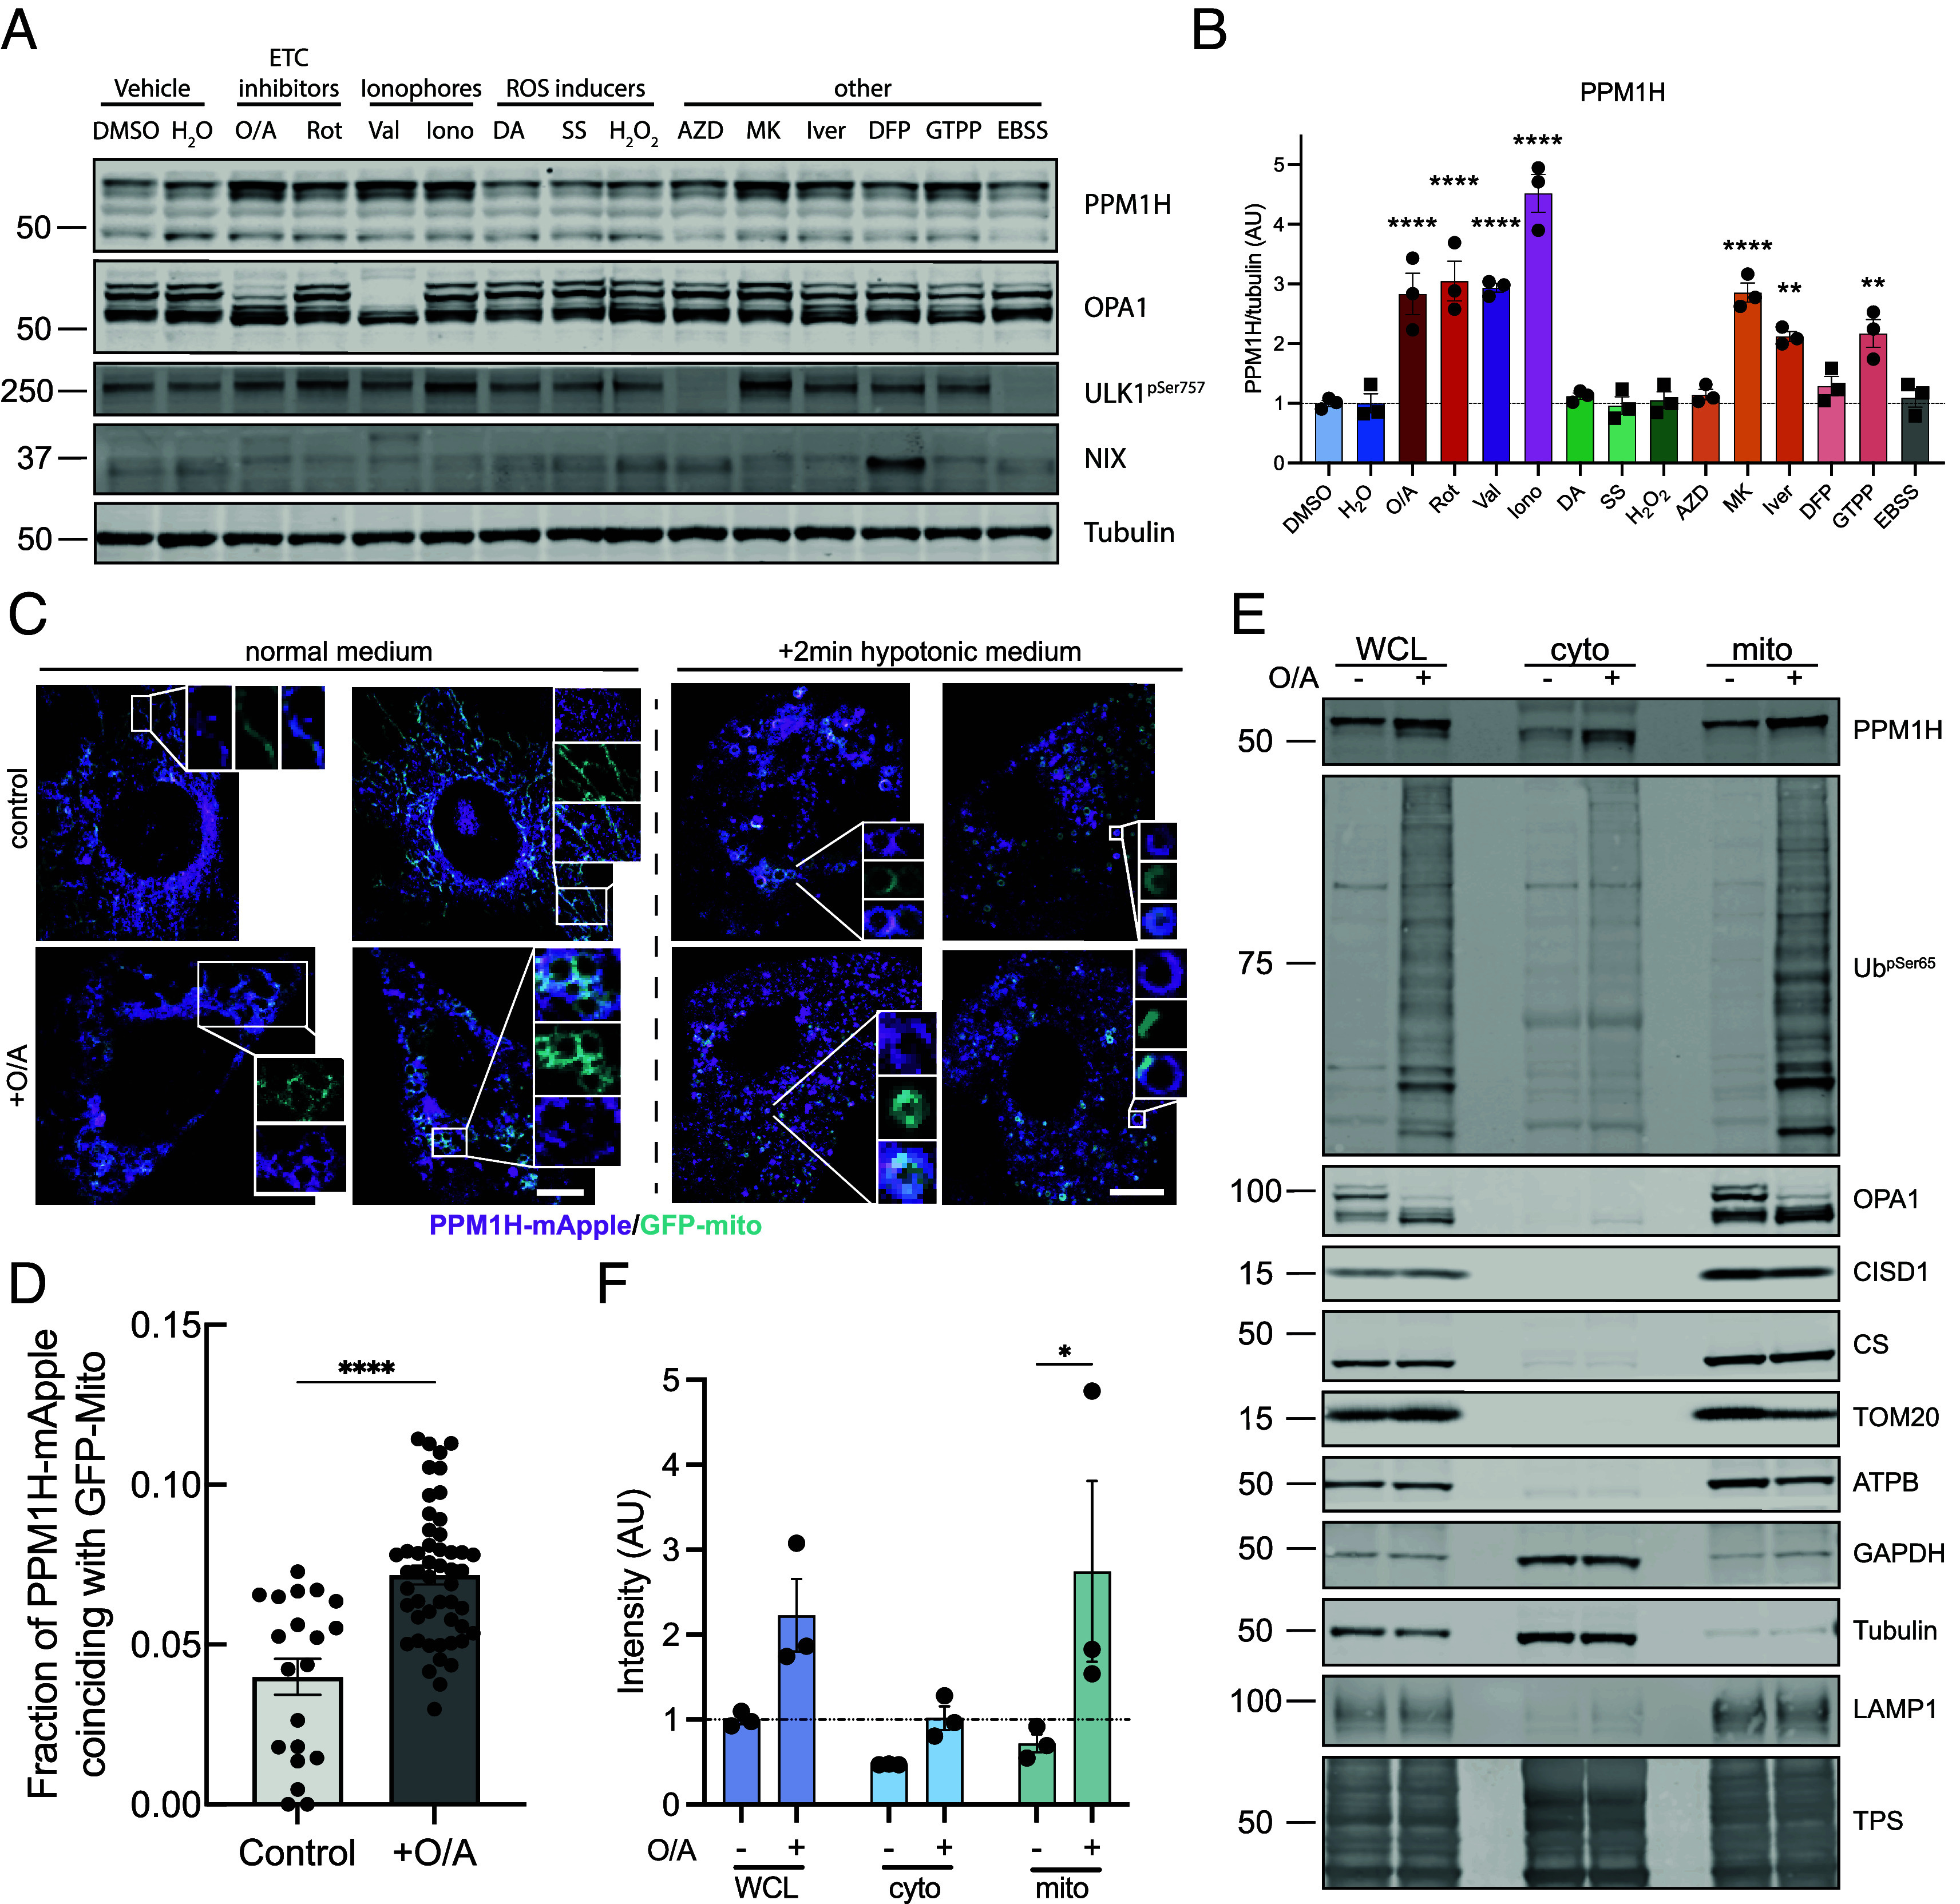
Endogenous PPM1H is up-regulated by different mitochondrial stressors and recruited to the organelle. (A) Representative immunoblot from PPM1HWT MEFs treated with different mitochondrial and cell stressors for 24 h and (B) quantification of PPM1H/tubulin from N = 3 independent experiment. (C) Live cell imaging of PPM1H-mApple MEF expressing a GFP mitochondrial tag treated with or without oligomycin/antimycin either in normal medium (Left) or hypotonic buffer (Right) and (D) relative quantification of colocalization of PPM1H-mApple and GFP-mito. (E) Immunoblot analysis of whole cell extract, cytoplasmic fraction, and crude mitochondrial fraction in PPM1HWT MEF after mitochondrial depolarization and (F) quantification of PPM1H levels in each of the three cellular compartments. O/A: Oligomycin/Antimycin (1/10 μM) Rot: Rotenone (0. 5 μM); Val: Valinomycin (2 μM); Iono: Ionomycin (5 μM); DA: Dopamine (10 μM); SS: Sodium selenite (7 μM); H2O2: Hydrogen peroxide (50 μM); AZD: AZD8055 (1 μM); MK: MK8722 (10 μM); Iver: Ivermectin (15 μM); DFP: deferiprone (1 mM); GTTP: Gamitrinib-triphenylphosphonium (5 μM); EBSS: Earle’s balanced salt solution. Each lane was loaded with 20 μg (15 μg for mitochondrial fraction) of protein lysates. Graphs show mean ± SEM from three independent experiments. For B–D, ordinary one-way ANOVA with Dunnett’s multiple comparison test versus DMSO (all compounds, black circles and *) or H2O (SS, H2O2, DFP, and EBSS, black squares and #). For D, unpaired Mann–Whitney test and for F, ordinary two-way ANOVA with Sidak’s multiple comparison test from three independent experiments (normalized to whole cell DMSO control). (Scale bar, 50 μm.)