
Fig. 3.
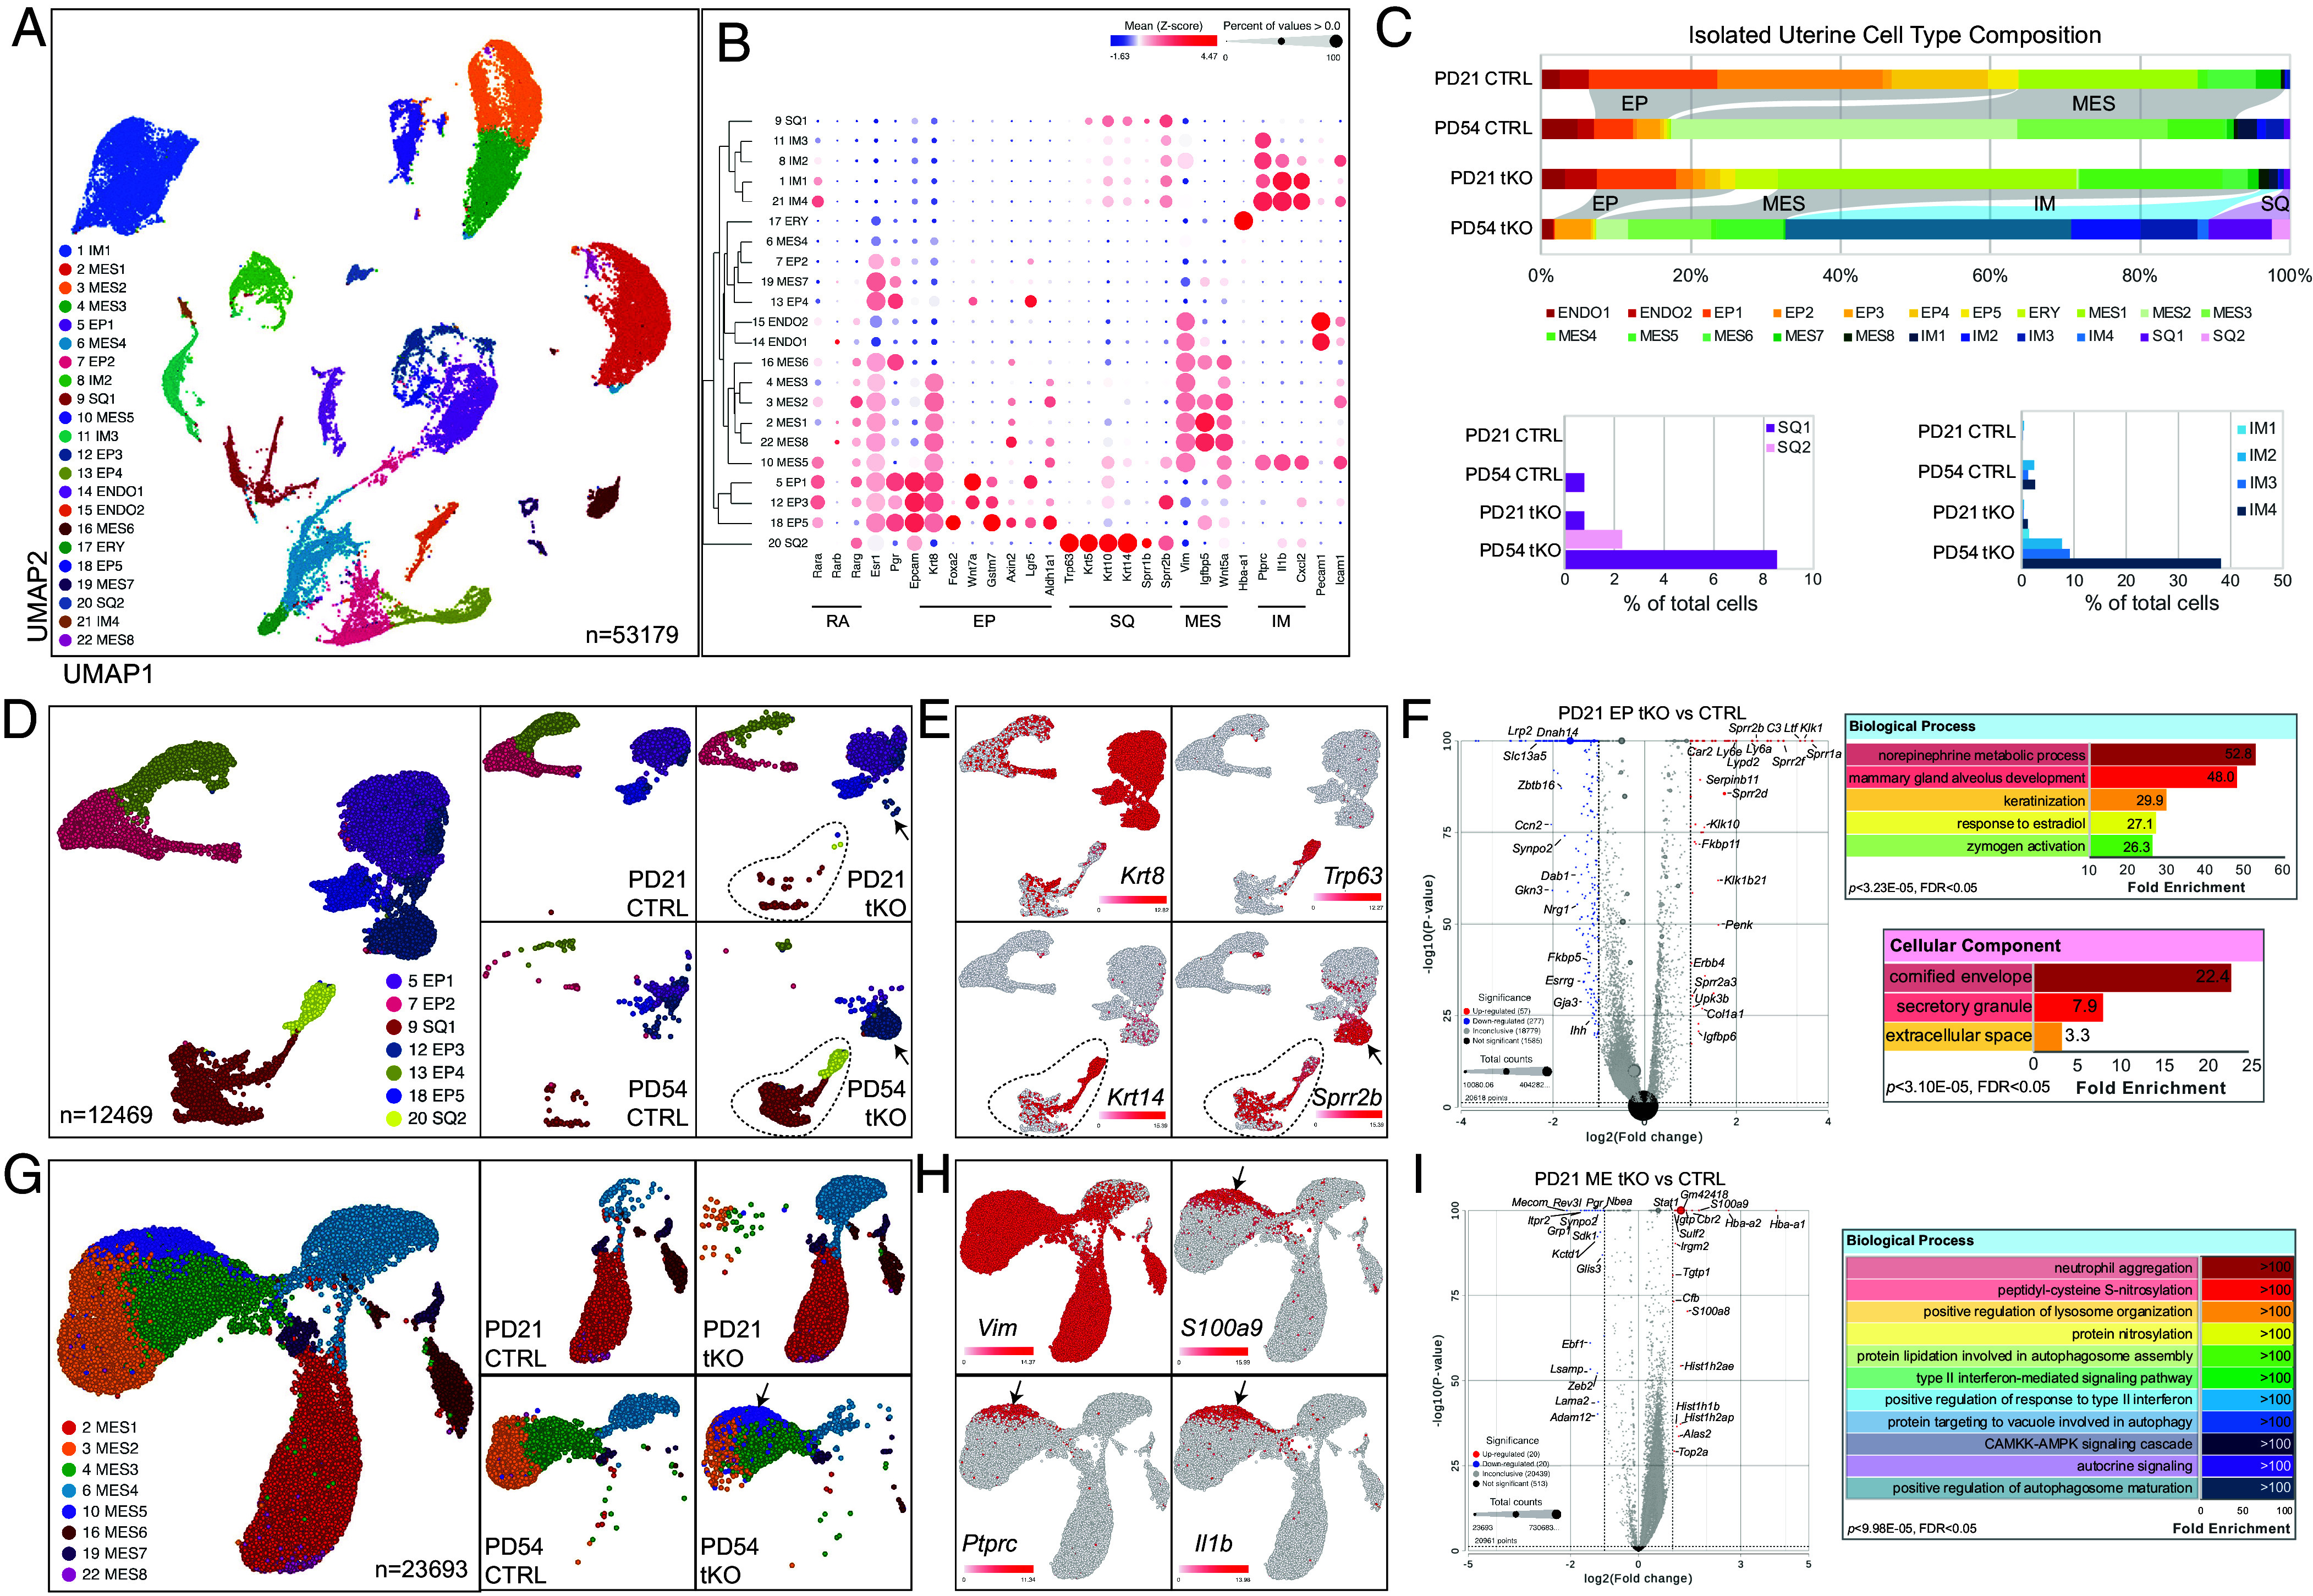
Delineating cellular profiles of tKO uterine cells by scRNAseq. (A) UMAPs of the 22 graph-based clusters of all sequenced cells. (B) Bubble map of selected marker expression in the 22 clusters. RA, retinoic acid-related; scEP simple columnar epithelium; ssEP, stratified squamous epithelium; MES, mesenchym; IM, immune. (C) Cell composition of isolated uterine cells of each biological sample. (D) UMAP of epithelial clusters and that of individual samples. Dotted lines outline squamous clusters and arrows point to cluster 18. (E) Expression of indicated markers by different epithelial clusters. (F) Volcano plot of genes expressed in epithelial clusters of PD 21 samples and GO analyses of the DRGs. (G) UMAP of mesenchymal clusters and that of individual samples. The arrow points to cluster 10. (H) Expression of indicated markers by different mesenchymal clusters. (I) Volcano plot of genes expressed in mesenchymal clusters of PD 21 samples and GO analyses of the DRGs.