
Fig. 5.
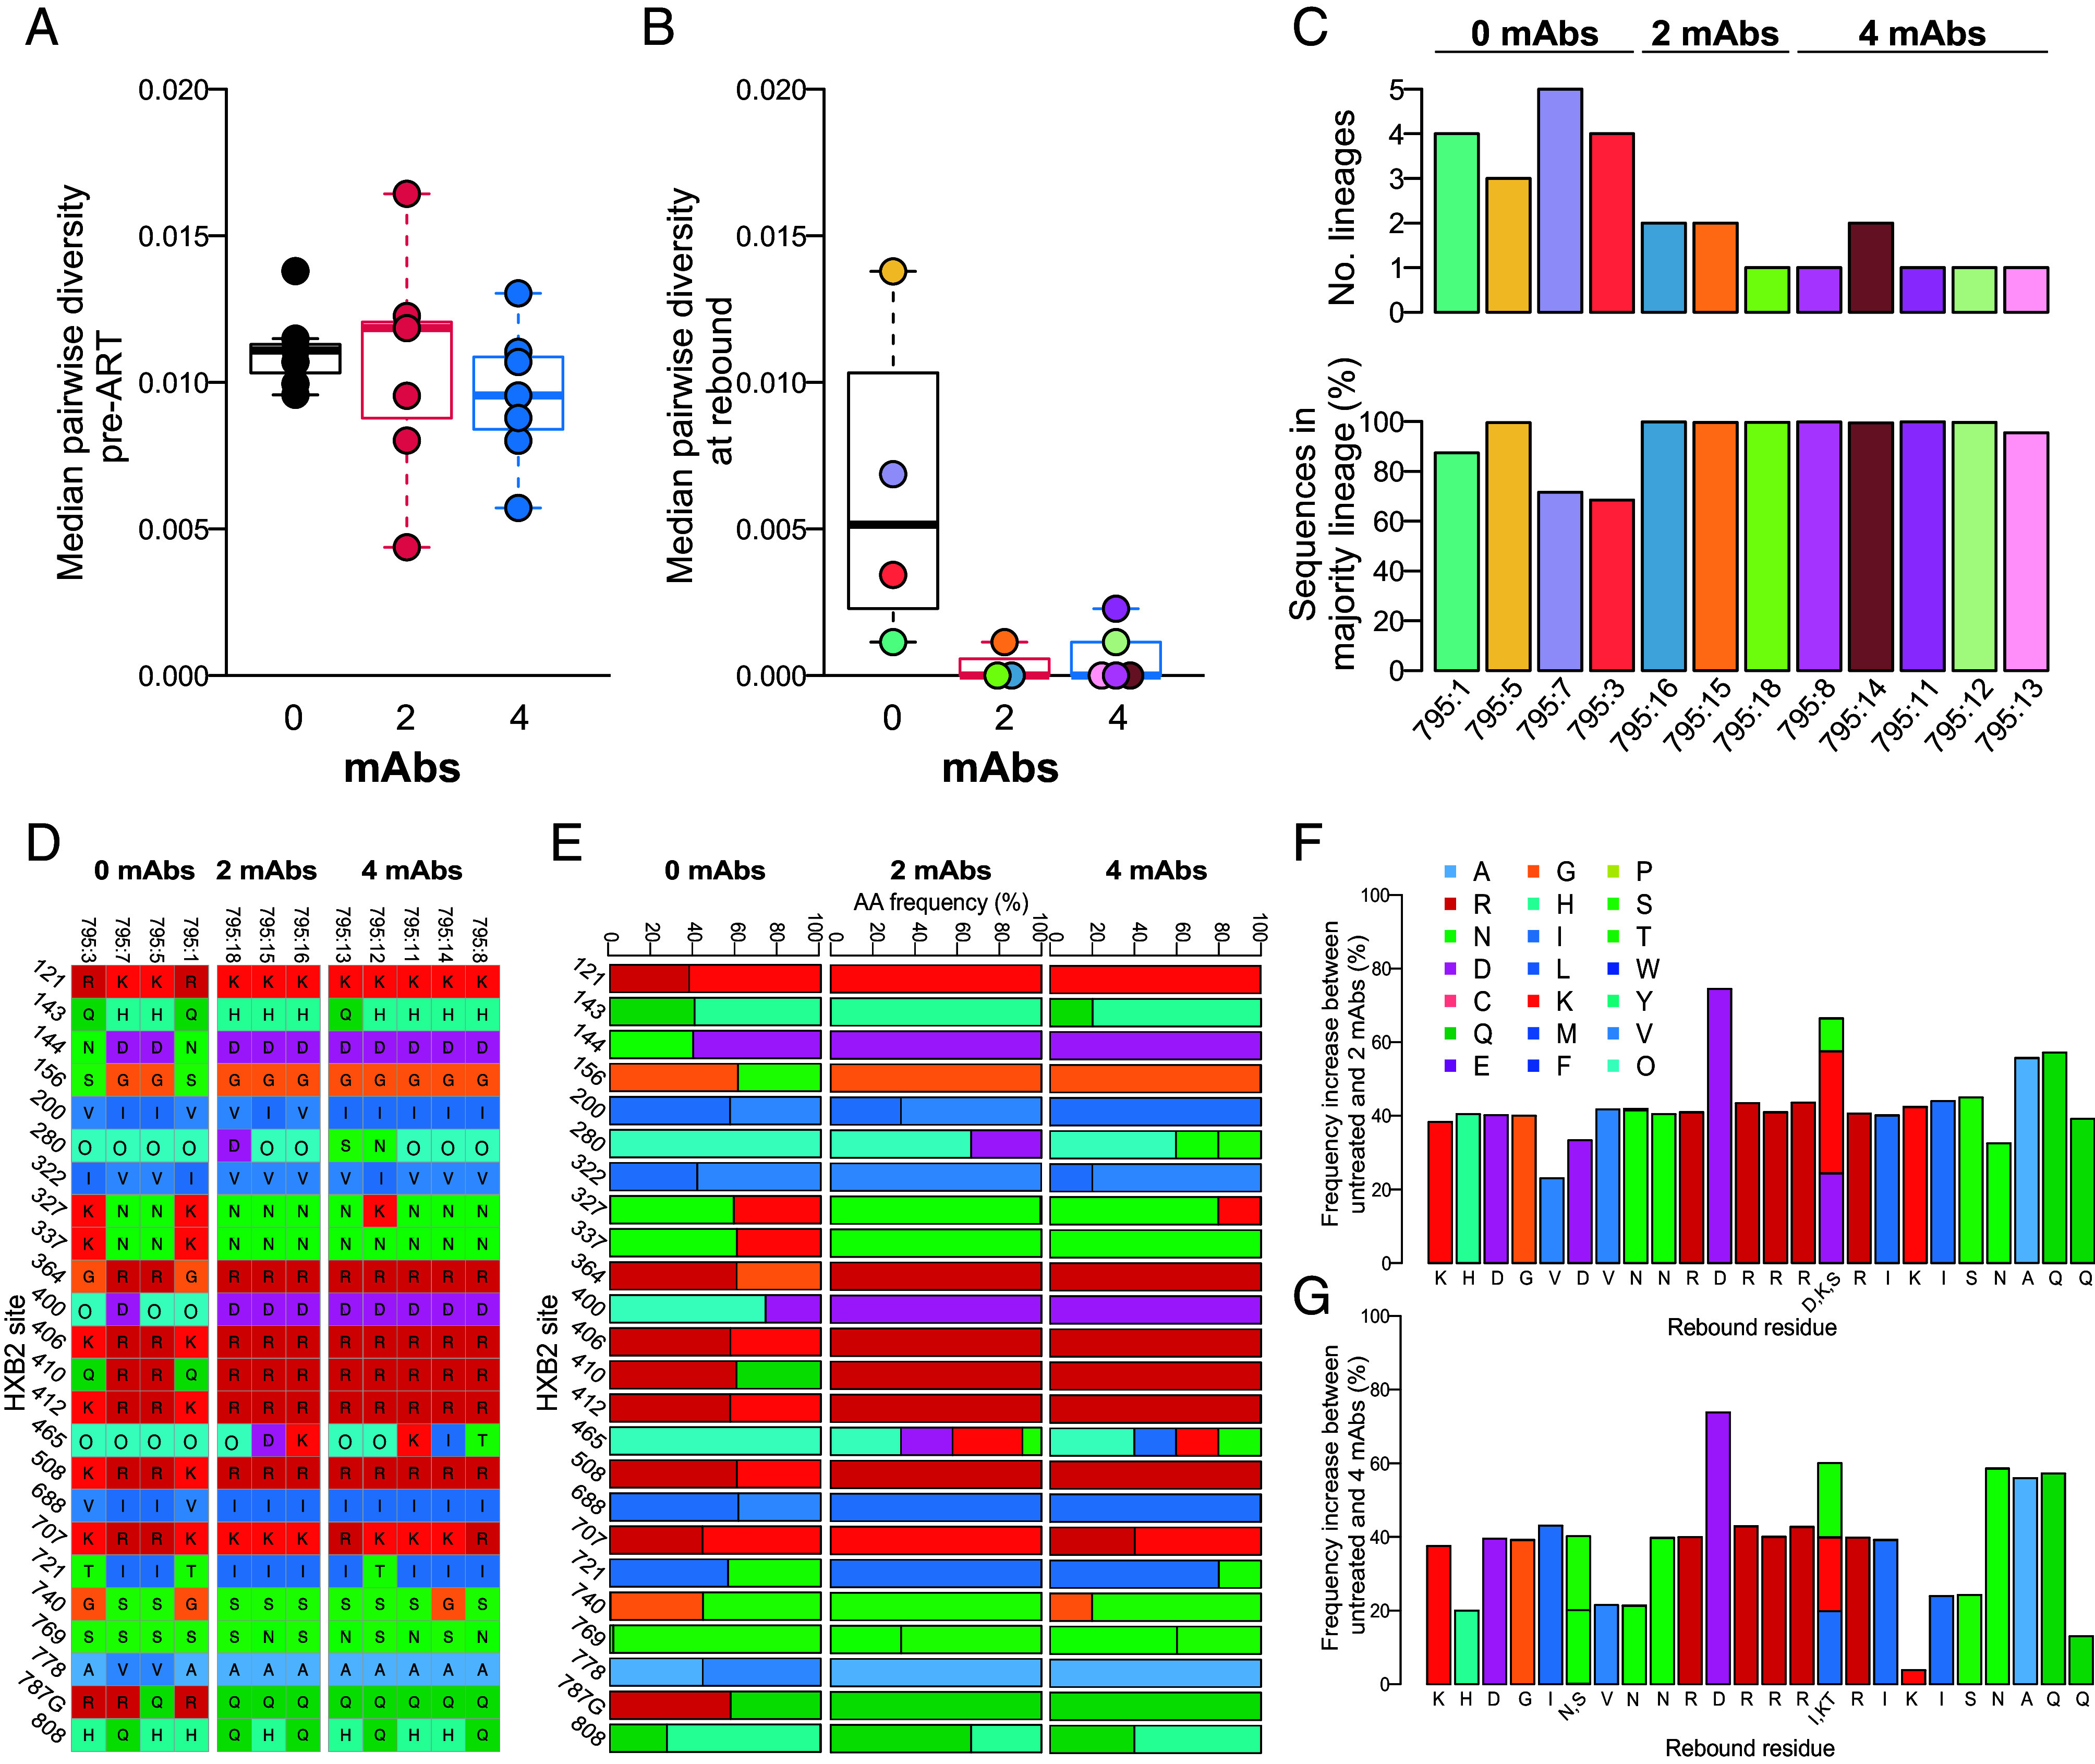
Impact of mAb treatment on SIV envelope sequence diversity and amino acid residue frequency. Boxplots of median pairwise envelope sequence diversity in untreated and treated animals at (A) pre-ART, measured by SGA, and (B) rebound, measured by deep sequencing in 12 of 21 animals. (C) The number of lineages and percentage of sequences found in the majority lineage in untreated and treated animals at rebound. (D–G) Env residues with differing frequencies between untreated and one or both of the treated groups in rebound virus. Amino acid identity corresponds to colors in legend at right; “O” indicates a PNGS. (D) Sequence alignment of consensus rebound sequences for animals treated with 0, 2, or 4 mAbs at sites identified to have shifted between untreated and treated animals. (E) Residue frequencies in PacBio rebound sequences. The increase in residue frequency compared to untreated animals in animals treated with (F) 2 mAbs and (G) 4 mAbs.