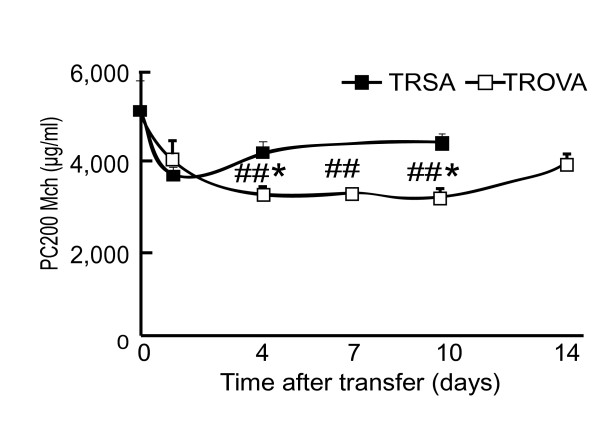
Figure 2.
Change in AHR following cell transfer. Recipients received spleen cells (5 × 10⁷) from SA-treated mice (TRSA) or OVA-sensitized mice (TROVA). AR was measured at the indicated time after the transfer (n = 8 per group). ## p < 0.01 compared with the baseline value (before the transfer) (ANOVA). * p < 0.05 compared with PC200Mch at the same time point of TRSA.

