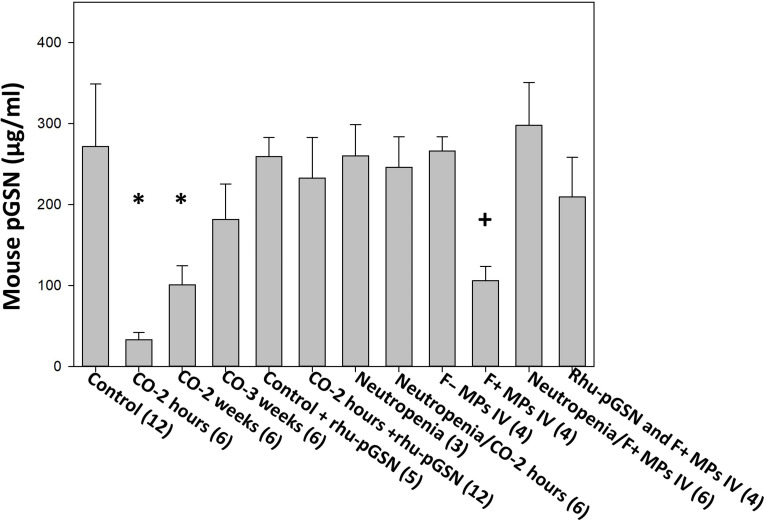
Fig. 3. Plasma gelsolin values.
The data indicators and mouse groups are as described in Fig. 1. Additional groups in the figure include control mice injected with rhu-pGSN at 27 mg/kg intravenously and euthanized 2 hours later, neutropenic mice not exposed to CO, and mice injected with 60,000 F-actin MPs in 200 μl of sterile PBS where the MPs were first incubated for 15 min with rhu-pGSN to cause particle lysis (20). The rhu-pGSN dose was the same as in other groups (27 mg/kg mouse) so that for an average 20-g mouse, the F-actin MPs had been incubated with rhu-pGSN at a concentration of ~2.7 μg/μl. *P < 0.001 vs. control (ANOVA) and +P < 0.001 for those injected with F-positive MPs versus F-negative MPs (t test).

