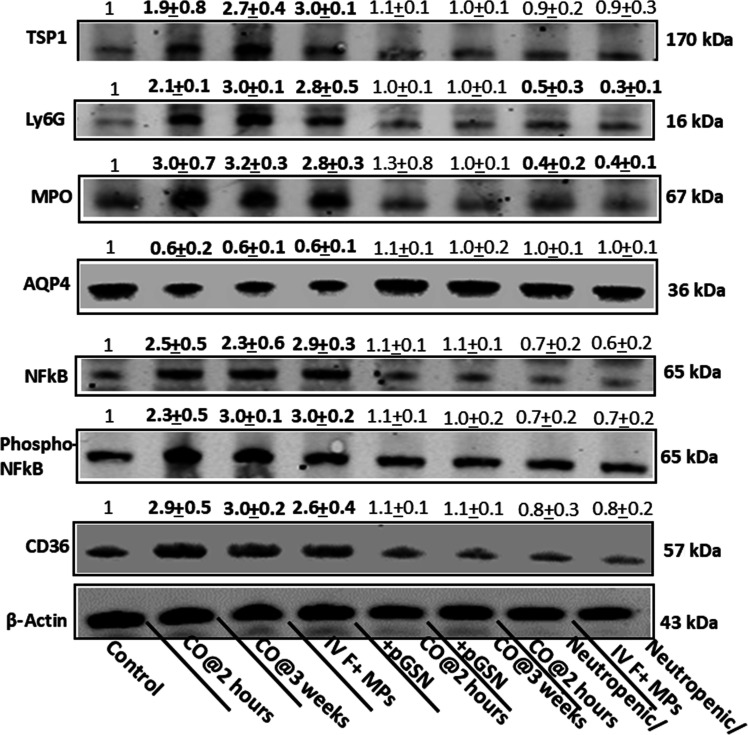
Fig. 5. Neuroinflammation assessed by Western blot.
A representative Western blot of brain homogenates is shown for mouse groups as described in Fig. 1 (not shown are data for 2 weeks post-CO and mice injected with F-actin–negative MPs as values for these mice were not significantly different from control) where numbers above each band indicate mean ± SD (n = 6 mouse brains per lane) band densities relative to β-actin of control samples from replicate studies. Bold numbers indicate values statistically significant from control (P ≤ 0.01 ANOVA). Blots were probed for NF-κB, p65-phosphorylated NF-κB (pNF-κB), myeloperoxidase (MPO), thrombospondin-1 (TSP), Ly6G, and CD36 proteins.

