Figure 1.
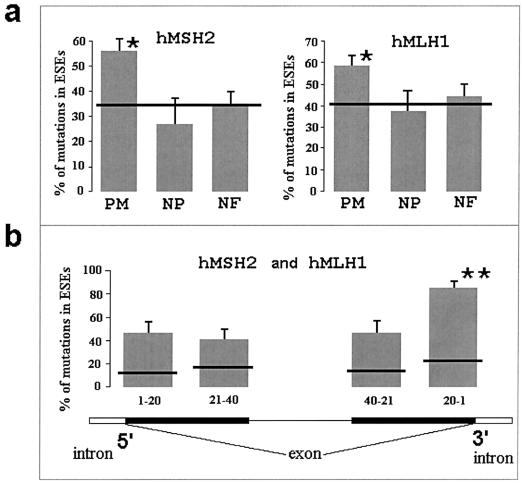
a, Frequency of ESE-associated mutations. Horizontal lines show the expected frequencies of mutations calculated as a proportion of the sequence occupied by ESE motifs. Differences between the expected and observed frequencies of pathogenic missense mutations (PM) were significant for both hMSH2 and hMLH1 (marked by an asterisk [*]). Nonpathogenic missense mutations (NP) show a trend to be underrepresented in ESEs. Nonsense and frameshift mutations (NF) did not show preferential association with ESE sites. Bars represent SEs of the frequencies. b, Positions of pathogenic missense mutations with respect to the 5′ and 3′ ends of an exon. The last 20 nts of exons had the highest frequency of mutations in ESEs: 83% of the mutations were in ESE sites (marked by a double asterisk [**]). The difference between the observed and expected numbers of mutations in that region was highly significant (χ2=33.8; df=1; P<.001). When the analysis was limited to short (average size, 80 nts) exons, the colocalization of the pathogenic missense mutations with ESE sites was even higher: 96% of the mutations were in ESEs.

