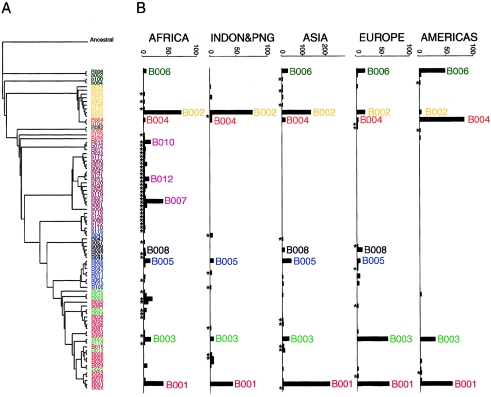
Figure 2.
NJ tree (A) of haplotype sequences and the corresponding haplotype frequencies (counts) (B) in five continental regions. Structural affiliations of haplotypes use the same color code as in figure 1. Asterisks (*) indicate haplotypes that occur in a single continental group.

