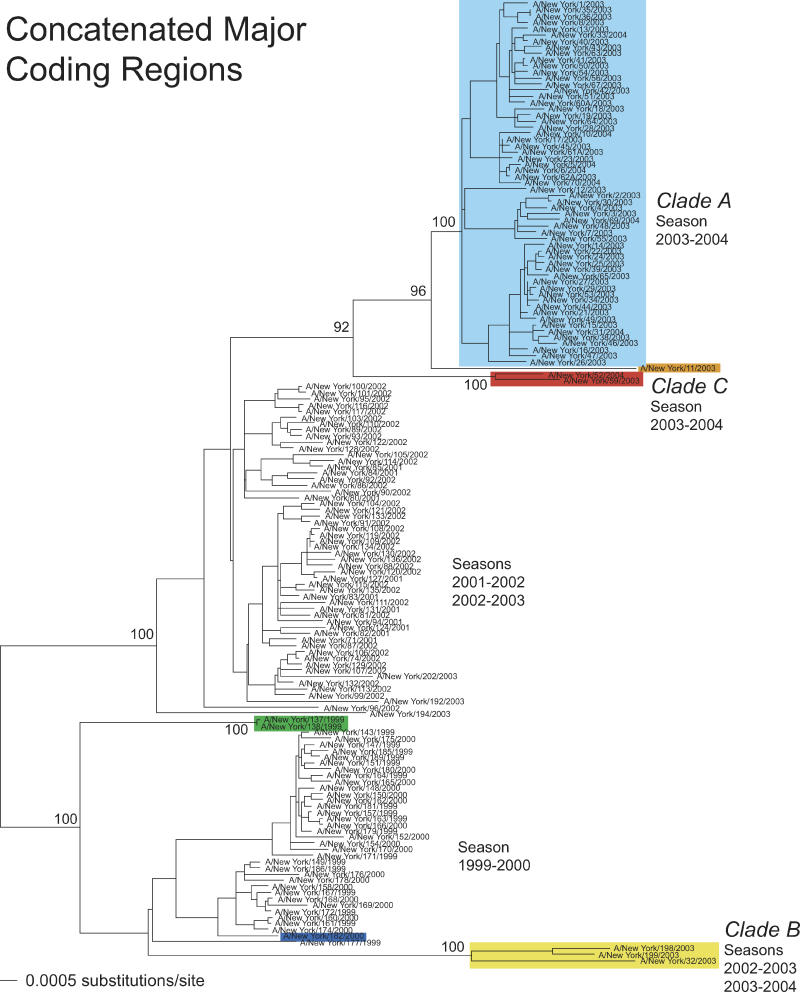
Figure 1. Evolutionary Relationships of Concatenated Major Coding Regions of Influenza A Viruses Sampled in New York State during 1999–2004.
The maximum likelihood phylogenetic tree is mid-point rooted for purposes of clarity, and all horizontal branch lengths are drawn to scale. Bootstrap values are shown for key nodes. Isolates assigned to clade A (light blue), clade B (yellow), and clade C (red) are indicated, as are those isolates involved in other reassortment events: A/New York/11/2003 (orange), A/New York/182/2000 (dark blue), and A/New York/137/1999 and A/New York/138/1999 (green).

