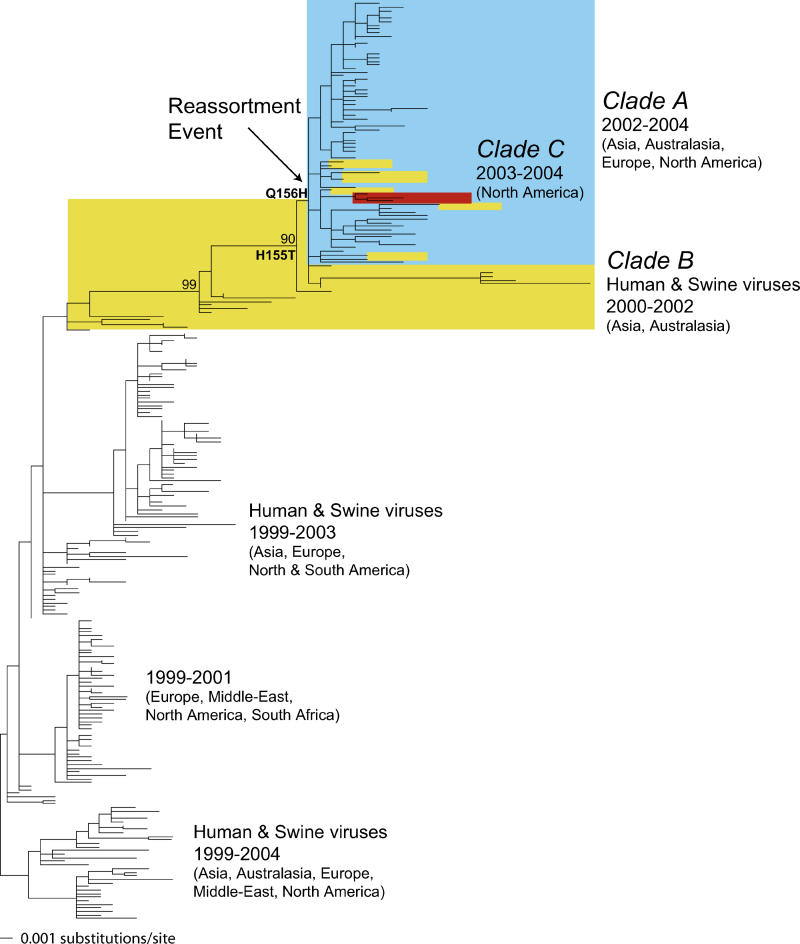
Figure 4. Evolutionary Relationships of 256 Sequences of the HA1 Sequences Sampled from Mammalian Hosts during 1999–2004.
The maximum likelihood phylogenetic tree is rooted on a divergent set of human and swine viruses for purposes of clarity only, and all horizontal branch lengths are drawn to scale. Bootstrap values are shown for key nodes. Colors are as in Figure 1, with yellow indicating all those viruses identified as clade B viruses from the analysis of the expanded NA dataset. The phylogenetic location of the reassortment event between clades A and B was set at the position of the most basal clade A virus, defined on the basis of the NA analysis, within the older clade B. The phylogenetic locations of the two critical antigenic mutations at sites 155 and 156 are also shown.

