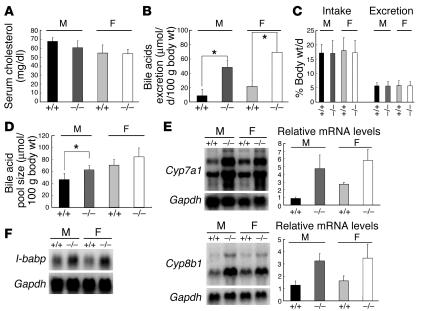
Figure 2.
Altered bile acid metabolism in βklotho–/– mice. Graphs show the comparison of several parameters in wild-type and knockout mice. (A) Serum cholesterol levels were compared using 4–6 animals per group. (B) Stool samples were collected daily for 3 days from 4–6 mice per group. Fecal excretion of total bile acids was measured, and the averages of 12–18 samples per group are shown. *P < 0.05. (C) Daily food intake and fecal excretion of 4 individuals per each genotype were examined for 3 days. (D) Comparison of bile acid pool size. Four to 10 mice per group were examined. (E) Expression of bile acid synthase genes Cyp7a1 and Cyp8b1 in wild-type and βklotho–/– mice. Total RNA (30 μg) from the livers of each genotype were analyzed. Representative results from 2 independent experiments are shown. Northern blots are shown in the left panel, and relative expression levels normalized for Gapdh levels are presented in the right panels. (F) Expression of intestinal bile acid binding protein (I-babp). Total RNA (30 μg) from the whole small intestine was analyzed. Results shown are from samples taken from age- and sex-matched littermates. All data in this figure were derived from 7-week-old mice fed standard diets. M, male; F, female. Error bars indicate SD.

