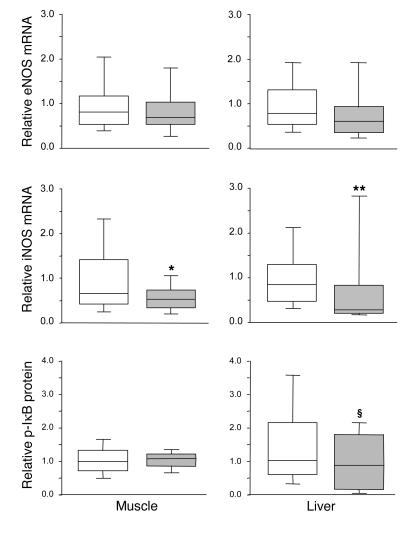
Figure 5.
NOS gene expression and NF-κB activation in postmortem biopsies. Transcript levels of eNOS and iNOS were measured in postmortem liver and skeletal muscle biopsies. NF-κB activation was evaluated in these tissues by analysis of the levels of phosphorylated IκB. Data are presented as box plots; the central line indicates the median, the box the IQR, and the whiskers the 10th and 90th percentiles. iNOS gene expression data were normally distributed. White boxes represent the patients in the conventional insulin therapy group (n = 49), gray boxes patients in the intensive insulin therapy group (n = 27). *P ≤ 0.05; **P ≤ 0.01; §P ≤ 0.1.

