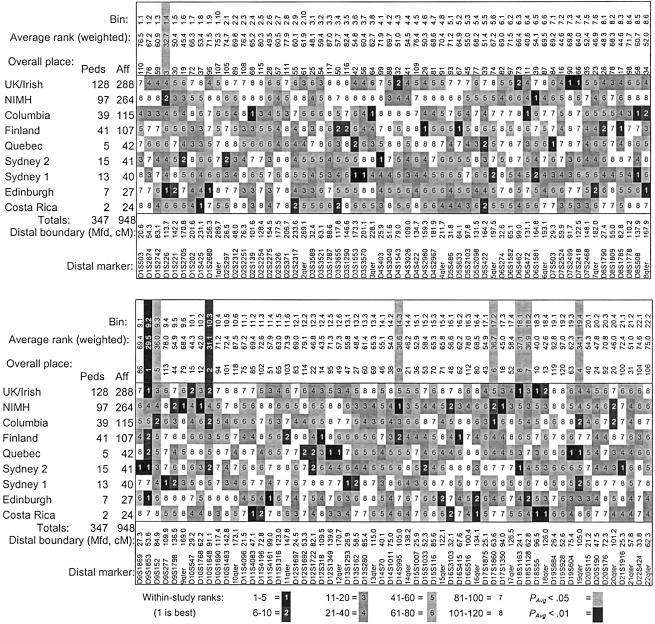
Figure 1.
Individual study and weighted average ranks by bin (model 1). The following are shown: within-study ranks (Rstudy) grouped as shown in the legend; the average rank (Ravg) for each bin across studies (low values are best), weighted proportional to  for each study; and the overall place of each bin in ascending order of average ranks (the lowest/best average rank is first-place). Average ranks with significant PAvgRnk values are highlighted above the columns (black for PAvgRnk<.01, gray for PAvgRnk<.05). Tied ranks sometimes resulted in uneven numbers of bins in some groupings, particularly for lower ranks when there were many zero or negative scores. Marshfield (“Mfd”) locations are shown for the marker at the distal boundary of each bin. Bin boundaries were selected at ∼30-cM spacing on the Généthon map; mean bin width is 29.1 cM on the Marshfield map. Peds = number of pedigrees; Aff = number of genotyped affected cases. See table 1 for the references associated with each study.

