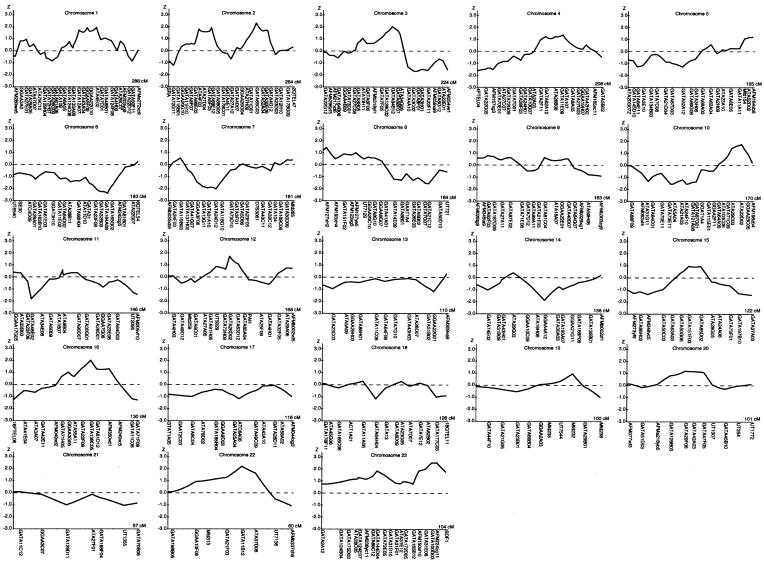
Figure 1.
Multipoint NPL analysis results for the AMD genome scan. Multipoint NPL scores were calculated with the Genehunter version 2.1 software package. In each graph, the chromosome number represented is indicated at the top of the chart, the NPL score is indicated on the left vertical axis and is traced on the curve. The positions of the microsatellite markers and the length of each chromosome are indicated on the horizontal axis.

