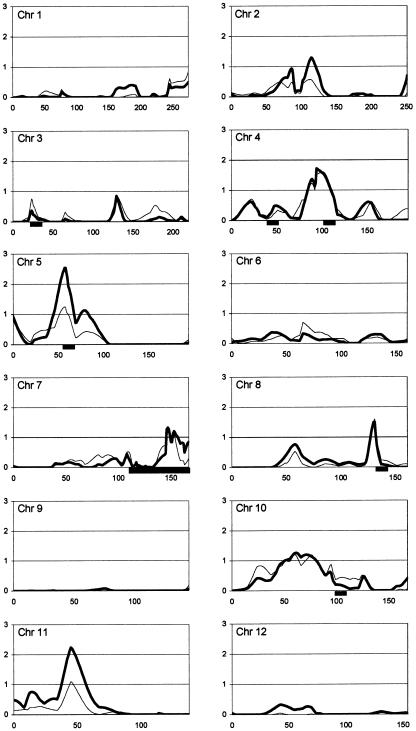
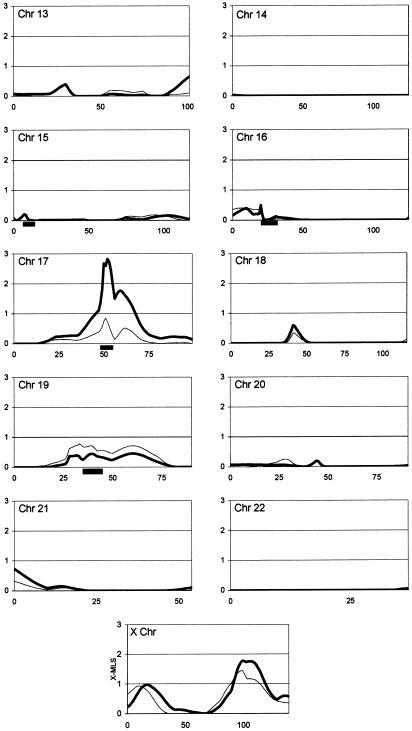
Figure 1.
Multipoint MLS results from Mapmaker/Sibs ASP analysis, shown by chromosome. The X-axis depicts genetic distance in Kosambi centimorgans from pter (zero coordinate) to qter; the Y-axis represents the MLS for all autosomes and the X-MLS for the X chromosome. Thin lines represent the narrow disease classification; thick lines represent the broad disease classification (see the “Families and Methods” section). Black bars below the X-axis show regions with dense microsatellite marker coverage.


