


ABSTRACT
Drug interactions are major causes of interindividual variability in tacrolimus exposure and effect. Tacrolimus, a widely used drug in transplant patients, is metabolized by CYP3A4 and CYP3A5. Cannabidiol (CBD) use after transplant is common. Clinical cases suggest CBD may alter tacrolimus exposure, but the mechanism of this interaction is unknown. We hypothesize that cannabidiol will inhibit tacrolimus metabolism in vitro mainly through CYP3A5 inhibition. In pooled human liver microsomes (HLMs) and recombinant (r) CYP3A4 and CYP3A5 enzymes, tacrolimus (1 μM) metabolism was determined using substrate depletion method in the absence (control) and the presence of 10 μM CBD, 7‐hydroxyCBD, and 7‐carboxyCBD. Ketoconazole (1 μM) served as a positive control for the inhibition of CYP3A. Linear regression analyses were performed to obtain kinetic parameters of the depletion. Tacrolimus depletion half‐life was 2.54, 0.922, and 0.351 min with pooled HLMs, rCYP3A4, and rCYP3A5, respectively. In pooled HLMs, CBD and 7‐hydroxyCBD increased tacrolimus half‐life by 0.8‐ and 2.3‐fold (both p < 0.0001), respectively. In rCYP3A4, CBD, 7‐hydroxyCBD, and ketoconazole prolonged tacrolimus half‐life by 5.8‐, 14‐, and 7.7‐fold, respectively. In rCYP3A5, CBD, 7‐hydroxyCBD, and ketoconazole prolonged half‐life by 29.3‐, 19.7‐, and 0.1‐fold, respectively. In all experiments, 7‐carboxyCBD had minimal effect on tacrolimus depletion. CBD and 7‐hydroxyCBD inhibited tacrolimus metabolism in vitro. CBD showed stronger inhibition in rCYP3A5 than rCYP3A4. The demonstrated CYP3A5 selectivity of cannabidiol may contribute to the in vitro identification of CYP3A5 substrates in new drug development. Our results support the potential of a clinical drug–drug interaction between CBD and tacrolimus.
Keywords: cannabinoid, CYP, drug–drug interactions, pharmacokinetics
Summary.
- What is the current knowledge on the topic?
-
○Case studies suggested the potential of a pharmacokinetic interaction between cannabidiol and tacrolimus, and in vitro studies have shown cannabidiol's inhibition on CYP3A4 and CYP3A5. However, this study uniquely investigates the effect of cannabidiol and its important metabolites on tacrolimus metabolism in vitro.
-
○
- What question did this study address?
-
○This study addressed the extent of inhibition of cannabidiol, 7‐hydroxycannabidiol, and 7‐carboxycannabidiol on tacrolimus metabolism as well as the proportion of inhibition through CYP3A4 and CYP3A5.
-
○
- What does this study add to our knowledge?
-
○Cannabidiol and 7‐hydroxycannabidiol both significantly inhibit tacrolimus metabolism in vitro. Cannabidiol has more selective CYP3A5 inhibition, while 7‐hydroxycannabidiol inhibits CYP3A4 and CYP3A5 to a similar extent.
-
○
- How might this change clinical pharmacology or translational science?
-
○The demonstrated CYP3A5 selectivity of cannabidiol may contribute to in vitro identification of CYP3A5 substrates in new drug development. As the demographics of clinical trials diversify, the proportion of participants who express CYP3A5 increases. Therefore, the identification of a CYP3A5 substrate has increasing significance.
-
○
1. Introduction
Tacrolimus is an immunosuppressant used by 80%–90% of solid organ transplant recipients as part of their lifelong immunosuppression regimen [1]. However, precision dosing of tacrolimus is challenging due to its narrow therapeutic window and the extensive intra‐ and interindividual variability, arising from variations in the genes involved in its disposition and non‐genetic factors, such as drug–drug interactions (DDIs). As a result, therapeutic drug monitoring (TDM) becomes challenging. The target whole blood trough concentration of tacrolimus ranges from 3 to 15 ng/mL, depending on the context [2, 3]. Subtherapeutic concentrations may increase the risk for organ rejection, and supratherapeutic concentrations (> 20 ng/mL) may precipitate adverse drug reactions, including nephrotoxicity [4]. Tacrolimus‐induced nephrotoxicity can manifest as either acute kidney injury or chronic allograft nephropathy through arteriolopathy and interstitial fibrosis [5, 6].
Tacrolimus is exclusively metabolized by CYP3A4 and CYP3A5 at the organ level [7]. The hepatic intrinsic clearance of tacrolimus by CYP3A5 is roughly twice that of CYP3A4 in vitro [8, 9]. CYP3A5‐genotyped clearances from a human study suggest that the fraction metabolized (fm) by CYP3A4 and CYP3A5 are 0.33 and 0.67, respectively [10]. Thus, one major contributor to tacrolimus interindividual variability in exposure is CYP3A5 genotype [11, 12]. CYP3A5 has seven identified alleles—normal function allele (*1), loss‐of‐function alleles (*3, *6, and *7), and unknown‐function alleles (*2, *8, and *9) [13]. CYP3A5*3 is the most common and well‐studied allele, and the CYP3A5*1/*3 polymorphism can explain up to 45% of interindividual variability in tacrolimus dosing requirements [14]. Individuals with at least one CYP3A5*1 allele are CYP3A5 expressors, whereas those who are homozygous for loss‐of‐function alleles are CYP3A5 non‐expressors [13]. These expression differences exhibit wide inter‐ethnic variability [14]. In CYP3A5 expressors, the systemic exposure of tacrolimus can be affected with concomitant CYP3A5 inhibitors or inducers.
Cannabidiol (CBD) is a phytocannabinoid approved by the Food and Drug Administration (FDA) for treating seizures associated with three rare genetic conditions and has ongoing trials exploring its other indications. The manufacturer of FDA‐approved CBD (Epidiolex) observed varying inhibitory strengths towards CYP1A2, CYP2C8, CYP2C9, CYP2C19, UGT1A9, UGT2B7, and potentially P‐glycoprotein (P‐gp) [15]. It may induce or inhibit CYP2B6 as well. The FDA drug interaction studies failed to reveal any effect of cannabidiol on midazolam exposure in healthy volunteers [16]. However, a subsequent academic study showed a small increase in midazolam exposure with concomitant CBD (58% increase in AUC) [17]. As midazolam is predominantly metabolized by CYP3A4 [18, 19], this suggests that CBD held minimal interaction through CYP3A4. Although potential interactions with CYP3A5 were not assessed, literature evidence supports that CBD is a CYP3A5 inhibitor [20]. Its inhibition was stronger towards CYP3A5 than CYP3A4, with half‐maximal inhibitory concentration (IC50) values of 1.65 μM and 11.7 μM, respectively. Because steady‐state concentrations of CBD at clinical dosages are in the micromolar range [21], it is possible that CBD significantly interacts with a CYP3A5 substrate like tacrolimus. Indeed, in two case studies, patients who had been stable on tacrolimus 5 mg twice daily had an up to 2.4‐fold increase in dose‐normalized tacrolimus concentrations after exposure to CBD [22, 23]. In a pilot study of healthy volunteers, we demonstrated that steady‐state CBD indeed increases tacrolimus Cmax and AUC significantly [24]; however, the mechanism for this interaction remains to be elucidated. Despite the lack of full pharmacokinetic characterization of CBD, the prevalence of CBD use by American adults is rising [25]. In fact, 17% of liver transplant recipients reported to be an active user of CBD for pain relief and anxiety [26]. In a case study, 86% of kidney transplant recipients had at least partial pain control and good tolerability with CBD in the first 15 days [27]. This points to the clinical utility of CBD in transplant recipients for chronic pain as an alternative to nonsteroidal anti‐inflammatory drugs (NSAIDs) that are nephrotoxic.
Considering the practical use of CBD in transplant recipients and the potential interaction between CBD and tacrolimus, it is crucial to determine the extent of a drug–drug interaction between tacrolimus and CBD. In this study, we investigated this interaction with pooled human liver microsomes (HLMs), CYP3A5 expresser and non‐expresser HLMs, and recombinant (r) CYP3A4 and CYP3A5. We hypothesize that CBD will inhibit tacrolimus metabolism in vitro mainly through CYP3A5 inhibition (Figure 1). The inhibitory potential of the active metabolite 7‐hydroxycannabidiol (7‐OH CBD) and the major metabolite 7‐carboxycannabidiol (7‐COOH CBD) was also explored under the same experimental conditions.
FIGURE 1.

Proposed inhibition of tacrolimus metabolism by cannabidiol. CBD is metabolized to 7‐OH CBD via CYP2C9 and CYP2C19, which is further metabolized to 7‐COOH CBD via both cytosolic and microsomal P450 enzymes [28, 29]. A potential 7‐CHO CBD metabolite may be appreciated between 7‐OH CBD and 7‐COOH CBD appearance. Metabolism of tacrolimus is predominantly mediated by CYP3A4 and CYP3A5 [30]. This study aims to explore the inhibition of tacrolimus metabolism by CBD and its metabolites. ALDH, aldehyde dehydrogenase; AOX, aldehyde oxidase; CBD, cannabidiol; 7‐CHO CBD, 7‐aldehydecannabidiol; 7‐COOH CBD, 7‐carboxycannabidiol; 7‐OH CBD, 7‐hydroxycannabidiol; 12‐HT, 12‐hydroxy tacrolimus; 13‐DMT, 13‐O‐desmethyl tacrolimus; 15‐DMT, 15‐O‐desmethyl tacrolimus; 31‐DMT, 31‐O‐desmethyl tacrolimus.
2. Methods
2.1. Chemicals and Reagents
Tacrolimus, rapamycin, and ketoconazole were purchased from MedChemExpress (Monmouth Junction, NJ). Cannabidiol, 7‐hydroxycannabidiol, and 7‐carboxycannabidiol were purchased from Sigma‐Aldrich (St. Louis, MO). Pooled HLMs from 50 donors of mixed gender (Catalog# H0610; Lot# 2010065), CYP3A5 expression‐specific HLMs (Catalog# H3A5.HA and H3A5.MA), and bacterial membranes containing rCYP3A4 (Catalog# CYP/EZ002; Lot# C3A4R057) or rCYP3A5 (Catalog# CYP/EZ046; Lot# C3A5R007) were purchased from XenoTech (Kansas City, KS). NADPH was purchased from Dot Scientific Inc. (Burton, MI). Sodium phosphate dibasic anhydrous (Na2H2PO4), sodium phosphate monobasic anhydrous (NaH2PO4), acetonitrile, methanol, methyl tertiary butyl ether (MTBE), and water were purchased from Fisher Scientific (Pittsburgh, PA). All chemicals and solvents were high‐performance liquid chromatography (HPLC) grade or higher.
2.2. Ultra‐High‐Performance Liquid Chromatography–Tandem Mass Spectrometry (UHPLC–MS/MS) Assay Method
We developed UHPLC–MS/MS methods to quantify tacrolimus and the internal standard (IS) rapamycin. The MS/MS analysis was performed on QTRAP 6500+ mass spectrometer (AB Sciex; Framingham, MA) equipped with a turbo V ion spray source and coupled with an ExionLC UHPLC system (AB Sciex; Framingham, MA) consisting of two AD pumps, an AD autosampler, an AD column oven, an AD degasser, and a controller. Data were acquired using Analyst software 1.7.0 (AB Sciex; Framingham, MA) and quantification was made via MultiQuant software version 3.0.2 (AB Sciex; Framingham, MA).
Chromatographic separation was achieved using an Agilent Zorbax‐SB C8 Rapid Resolution threaded column (150 × 4.6 mm inner diameter; 5‐μm particle size; Santa Clara, CA) on the UHPLC. An isocratic mobile phase composed of acetonitrile and 5 mM ammonium acetate (90:10, v/v) with a flow rate of 0.9 mL/min was used. The mass spectrometer was operated with electrospray ionization (ESI) in the positive mode with multiple reaction monitoring (MRM). Global parameters for the mass spectrometer were optimized across all analytes under unit resolution for quadrupole 1 and 3: collision gas medium, curtain gas 30 psi, ion spray voltage 5500 V, source temperature 450°C, Gas 1 40 psi, Gas 2 50 psi, and interface heater (ihe) on. Their declustering potential (DP), entrance potential (EP), collision energy (CE), and cell exit potential (CXP) were as follows in respective order: (tacrolimus) 70, 10, 31, and 35; (rapamycin) 25, 10, 24, and 20. To quantify tacrolimus and rapamycin, the MRM precursor‐to‐product ion transition m/z 821.3/768.3 and m/z 932.51/865.4 (ammonium adduct) were utilized, respectively.
We were unable to obtain major tacrolimus metabolites through a reliable commercial source, so the substrate depletion approach was chosen over the metabolite formation approach. Prior to each experiment, a linear standard curve of tacrolimus was generated. The concentrations to generate a standard were 0, 0.03, 0.1, 0.3, 1, 3, and 10 μM for incubation with HLMs, and 0, 0.03, 0.1, 0.3, 1, and 3 μM for incubation with rCYP3A4 and rCYP3A5. The lower limit of quantification (LLOQ) was 0.124 nM for both incubation systems. Quality control was performed at 0.02, 0.2, and 2 μM. Variabilities of standard and quality control samples were assessed by MultiQuant software. The acceptable intra‐day and inter‐day variabilities were less than 10% and 20%, respectively. The peak ratio of analytes was the same after 24 h of the first UHPLC–MS/MS analysis.
2.3. Incubation Procedures
Tacrolimus was incubated with pooled HLMs, rCYP3A4, and rCYP3A5 in the absence (control) and presence of CBD, 7‐OH CBD, 7‐COOH CBD, and ketoconazole (a known CYP3A inhibitor serving as a positive control for inhibition). The experiments with pooled HLMs were performed in four technical replicates. The experiments with rCYP3A4 and rCYP3A5 were performed in two technical replicates.
2.3.1. HLMs
For pooled HLMs incubation experiments, tacrolimus stock solution was diluted with phosphate buffer (0.2 M; pH 7.4) to 1 μM in 0.65‐mL tubes on a 96‐well plate on ice. We used a published Km value of 1.5 μM for CYP3A4 and 1.4 μM for CYP3A5 to determine the ideal tacrolimus starting concentration (1 μM) for the depletion assay [9]. Into the dilutions, one potential inhibitor was added: CBD (10 μM), 7‐OH CBD (10 μM), 7‐COOH CBD (10 μM), or ketoconazole (1 μM). The resultant drug mixture was 100 μL in each tube. To each tube, 30 μL of pooled HLMs (0.5 mg/mL final concentration) prepared in phosphate buffer was added. The 0.65‐mL tubes were pre‐warmed on a heating block at 37°C for 5 min. The reaction was initiated by adding 20 μL of NADPH (1 mM) prepared in phosphate buffer. The reaction was quenched by adding 300 μL of ice‐cold methanol with 10 ng/mL rapamycin (IS) at 0, 5, 10, 15, 20, and 30 min. The entire 96‐well plate was vortexed for 30 s. The samples were transferred from 0.65‐mL tubes to 16 × 100 mm disposable culture tubes with the addition of 2 mL of MTBE. The plate with culture tubes was vortex mixed for 30 s and spun at 3600 rpm for 10 min. The supernatant was transferred to 13 × 100 glass test tubes and evaporated to dryness. The pellet was reconstituted with 60 μL of methanol, and 5 μL of it was injected into the UHPLC–MS/MS system. Before and after each injection, the needle was washed with a mixture consisting of 50% of 0.1% formic acid in water, 25% of acetonitrile, and 25% of isopropanol. Experiments with expression‐specific HLMs were performed in an identical manner, but the only inhibitors tested were CBD (10 μM) or 7‐OH CBD (10 μM).
2.3.2. CYP3A4 and CYP3A5 Quantitation
The protein content of pooled, CYP3A5 expresser, and CYP3A5 non‐expresser HLMs were quantitated on an Orbitrap Eclipse Tribrid HPLC‐MS/MS with easy‐spray source and an aurora column with Field Asymmetric Ion Mobility Spectrometry. Proteins were fragmented using Higher‐energy Collision Dissociation fragmentation to generate MS2 spectra. Data were analyzed in Proteome Discover (PD) 2.5 software, accessing the Human reference proteome database and common contaminants.
2.3.3. rCYP3A4 and rCYP3A5
The incubation procedure for rCYP3A4 and rCYP3A5 was similar to that described for pooled HLMs with the following differences. Rather than using 30 μL of pooled HLMs, 10 μL of recombinant enzymes (10 pmol/150 μL final concentration) were used, with 20 μL phosphate buffer to make up the remaining volume. The time points for adding ice‐cold methanol and rapamycin to quench the reaction were 0, 1, 2.5, 5, 7.5, and 10 min.
2.4. Kinetic Analysis
The amount of tacrolimus and rapamycin (IS) in analytes at each time point was displayed as chromatographic peaks on an absorbance‐time plot. The area under the curve (AUC) of the peaks was obtained. The ratio of AUC for tacrolimus to rapamycin was calculated. The AUC ratio was converted to the concentration of tacrolimus (μM) using the slope of the standard curve generated for each experiment. The percent tacrolimus remaining after incubation is calculated by comparing the peak area of tacrolimus at each time point to time zero (t 0). As such, a plot of percent remaining of tacrolimus against time would show the rate of depletion of tacrolimus alone and when co‐incubated with CBD, 7‐OH CBD, 7‐COOH CBD, or ketoconazole. The absolute value of the slope of the linear regression is the first‐order depletion rate constant from which the half‐life was calculated using Equation (1):
| (1) |
where t 1/2 is the half‐life of substrate (min) and k dep is the depletion rate constant (min−1).
2.5. In Vitro‐In Vivo Extrapolation
2.5.1. Pooled HLM
The in vitro‐in vivo extrapolation (IVIVE) of intrinsic clearance obtained from incubation with pooled HLMs was performed with a series of calculations [31]. The in vitro intrinsic clearance (CLint,HLM) was calculated using Equation (2), where V (mL/mg) is the inverse of the concentration of microsomal protein; fumic is the fraction unbound in microsomes. Fumic was estimated with the partition coefficient (logP) and concentration of microsomal protein ([HLM]) using Equation (3) [32]. From CLint,HLM, the in vivo intrinsic clearance of the liver (CLint) was extrapolated with two physiologically based scaling factors—microsomal protein per gram of liver (MPPGL) and liver weight/body weight (LW/BW)—using Equation (4). Further, the hepatic intrinsic clearance based on whole blood unbound drug concentration (CLH,B) was extrapolated from CLint,HLM by accounting for additional scaling factors—hepatic blood flow per body weight (QH,B) and fraction of unbound drug in blood (fuB)—using Equation (5). Hepatic blood flow was set at 24.5% of the average cardiac output of 5600 mL [33, 34]. The factor fuB was calculated by dividing fuP by blood‐to‐plasma ratio (B/P) as shown in Equation (6) [35, 36]. Finally, hepatic extraction ratio derived from the unbound drug concentration in whole blood (EH,B) was calculated using Equation (7). A summary of parameters used for pharmacokinetic calculation and extrapolation is provided in Table 1.
| (2) |
| (3) |
| (4) |
| (5) |
| (6) |
| (7) |
TABLE 1.
Summary of parameters for pharmacokinetic calculation and extrapolation.
| Parameter | Value | Source |
|---|---|---|
| Tacrolimus | ||
| logP | 3.26 | Gertz et al. [37] |
| fuP | 0.012 ± 0.0012 | Zahir et al. [38] |
| B/P ratio | 35 | Gertz et al. [37] |
| Physiological | ||
| MPPGL (mg/g) | 40 | Hakooz et al. [39] |
| LW/BW a (g/kg) | 25.7 | Davies and Morries [33] |
| QH,B a (mL/min/kg) | 19.6 | Davies and Morries [33] |
Abbreviations: B/P ratio, blood‐to‐plasma ratio; fuP, fraction unbound in plasma; logP, partition coefficient between octanol and water; LW/BW, liver weight per body weight; MPPGL, microsomal protein per gram of liver; QH,B, hepatic blood flow per body weight.
Based on a 70‐kg human.
2.5.2. rCYP3A4 and rCYP3A5
The intrinsic clearance derived from recombinant enzymes (CLint,rCYPi) was calculated with Equation (8). The fraction unbound in recombinant incubations (furCYPi) was determined with Equation (9).
| (8) |
| (9) |
2.6. Statistical Analysis
All statistical analyses and data visualizations were performed with GraphPad Prism 10.2.1 (GraphPad software, Boston, MA) on Windows 10. Descriptive statistics (mean and standard deviation) were obtained for depletion (k dep) and percent tacrolimus remaining. Linear regression analysis was performed to fit the natural log‐transformed data. Data normality and equality of variance were assessed by Shapiro–Wilk test and F‐test, respectively. Since the data followed Gaussian distribution with unequal variance, Brown‐Forsythe and Welch ANOVA with post hoc Dunnett's T3 multiple comparison testing were used to compare the regression slopes of each group to the control. A two‐tailed, multiplicity adjusted p‐value < 0.05 was considered statistically significant.
3. Results
3.1. Chromatograms
Typical chromatograms of tacrolimus and rapamycin are displayed in Figure 2. These peaks showed short retention times (tacrolimus, 2.16 min; and rapamycin, 2.09 min), and both were sharp and smooth. The method was robust, reproducible, and high throughput.
FIGURE 2.
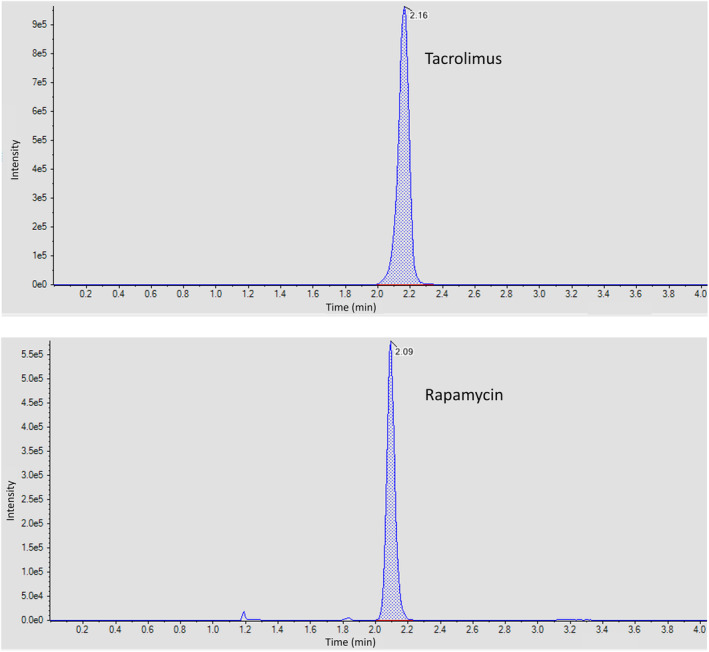
UHPLC chromatograms. This is an ion current versus time plot obtained from chromatography. Peaks were scaled relative to the peak with highest intensity.
3.2. Inhibition of Tacrolimus in Pooled Human Liver Microsomes
The demographics of the 50 donors for our pooled HLMs were as follows: 44 Caucasians (88%), 4 Hispanics (8%), 1 African American (2%), and 1 Asian (2%); 29 males (58%) and 21 females (42%) [40]. Depletion of tacrolimus in pooled HLMs was dependent on nicotinamide adenine dinucleotide phosphate (NADPH), duration of incubation, and microsomal protein and tacrolimus concentrations (data not shown). When co‐incubated with tacrolimus in pooled HLMs, CBD and 7‐OH CBD showed statistically significant inhibition of tacrolimus depletion as compared to the control incubation (Figure 3). CBD reduced tacrolimus k dep from 0.27 ± 0.012 min−1 to 0.15 ± 0.0069 min−1 (reduced by 44%, p < 0.0001) (Table 2). 7‐OH CBD reduced tacrolimus k dep to 0.083 ± 0.0041 min−1 (2.3‐fold reduction, p < 0.0001). In contrast, 7‐COOH CBD had minimal inhibition (reduced by 19%, p = 0.02). The positive control, ketoconazole, strongly reduced tacrolimus k dep to 0.024 ± 0.0026 min−1 (10.3‐fold reduction, p < 0.0001).
FIGURE 3.

Inhibition of tacrolimus depletion by CBD, 7‐OH CBD, 7‐COOH CBD, and ketoconazole with pooled HLMs. Tacrolimus (1 μM) was incubated alone and with CBD (10 μM), 7‐OH CBD (10 μM), 7‐COOH CBD (10 μM), or ketoconazole (1 μM) in the presence of 50‐donor pooled HLMs (0.5 mg/mL) and NADPH (1 mM) in phosphate buffer (0.2 M; pH 7.4) for 0, 5, 10, 15, 20, and 30 min. Tacrolimus depletion was quantified using the peak area ratio of tacrolimus to rapamycin, internal standard, and a standard curve (0 to 10 μM). The lower limit of quantification was 0.124 nM. The percentage of tacrolimus remaining was calculated and natural log‐transformed (A). Subsequently, regression analysis was performed on data in the linear range (B). The negative slope is the depletion rate constant from which half‐life was calculated. Points represent the mean ± SD (A) or mean ± SEM (B) of four technical replicates. CBD, cannabidiol; HLM, human liver microsome; 7‐COOH CBD, 7‐carboxycannabidiol; 7‐OH CBD, 7‐hydroxycannabidiol. *adjusted p < 0.05; ****adjusted p < 0.0001.
TABLE 2.
Pharmacokinetic parameters of tacrolimus depletion with pooled HLMs.
| Tacrolimus | Tacrolimus + Ketoconazole | Tacrolimus + CBD | Tacrolimus + 7‐OH CBD | Tacrolimus + 7‐COOH CBD | |
|---|---|---|---|---|---|
| Pooled HLMs (fumic = 0.67) | |||||
| k dep (min−1) | 0.27 ± 0.012 | 0.024 ± 0.0026 | 0.15 ± 0.0069 | 0.083 ± 0.0041 | 0.22 ± 0.013 |
| t 1/2 (min) | 2.54 | 28.4 | 4.56 | 8.39 | 3.13 |
| CLint,HLM (mL/min/mg microsomal protein) | 0.81 | 0.073 | 0.45 | 0.25 | 0.66 |
| CLint (mL/min/kg) | 835 | 74.7 | 465 | 253 | 678 |
| CLH,B (mL/min/kg) | 0.28 | 0.026 | 0.16 | 0.086 | 0.23 |
| EH,B | 0.014 | 0.0013 | 0.0083 | 0.0044 | 0.012 |
Note: Data for k dep are presented in mean ± SEM. Values less than 1 are rounded to two significant figures, while all other values are rounded to three significant figures.
Abbreviations: CBD, cannabidiol; CLH,B, hepatic intrinsic clearance of tacrolimus based on blood concentrations; CLint, in vivo intrinsic clearance of tacrolimus in a liver; CLint,HLM, in vitro intrinsic clearance of tacrolimus in human liver microsomes; EH,B, hepatic extraction ratio of tacrolimus based on blood concentrations; fumic, fraction unbound in microsomes; HLM, human liver microsome; k dep, depletion rate constant; t 1/2, half‐life; 7‐COOH CBD, 7‐carboxycannabidiol; 7‐OH CBD, 7‐hydroxycannabidiol.
The calculated t 1/2 of tacrolimus was 2.54 min for pooled HLMs. CBD, 7‐OH CBD, and ketoconazole prolonged it to 4.56 min, 8.39 min, and 28.4 min, respectively (same fold‐change magnitude as k dep). The decrease of CLint,HLM from all experimental conditions to control was similar to that of k dep, with V and fumic kept constant. In summary, the depletion of tacrolimus over time was significantly inhibited by CBD, 7‐OH CBD, and ketoconazole (Figure S1, Table S1).
3.3. In Vitro‐In Vivo Extrapolation
CLH,B was scaled from CLint,HLM with the assumption of a well‐stirred liver model based on whole blood unbound concentration of tacrolimus. CLH,B was extrapolated to be 0.28 mL/min/kg (or 0.017 L/h/kg). This is broadly consistent with other published clinical literature on the total body clearances of tacrolimus in healthy volunteers and transplant recipients (0.03 to 0.09 L/h/kg) [41]. EH,B was calculated from CLH,B, and estimated to be 0.014, which was slightly below the reported hepatic extraction ratios in humans ranging from 0.026 to 0.077 [41].
3.4. Inhibition of Tacrolimus in rCYP3A4 and rCYP3A5
We next sought to understand the relative inhibition of CYP3A4 and CYP3A5 by CBD and its metabolites, using recombinant enzymes expressed on bacterial membranes. Ketoconazole was used as the positive control for both enzymes. For rCYP3A4, CBD and ketoconazole had comparable inhibition of tacrolimus depletion (Figure 4). CBD slowed tacrolimus k dep with rCYP3A4 from 0.75 ± 0.046 min−1 to 0.11 ± 0.017 min−1 (5.8‐fold reduction, p < 0.0001), while ketoconazole slowed it to 0.086 ± 0.017 min−1 (7.7‐fold reduction, p < 0.0001) (Table 3). In contrast, 7‐OH CBD reduced tacrolimus k dep with rCYP3A4 by 14‐fold to 0.050 ± 0.015 min−1 (p < 0.0001), which was slightly greater than the effect of ketoconazole. 7‐COOH CBD did not affect tacrolimus depletion (p = 0.46). The calculated t 1/2 of tacrolimus was 0.92 min with rCYP3A4. CBD, 7‐OH CBD, and ketoconazole prolonged it to 6.11 min, 14.0 min, 8.06 min, respectively (same fold‐change magnitude as k dep).
FIGURE 4.

Inhibition of tacrolimus depletion by CBD, 7‐OH CBD, 7‐COOH CBD, and ketoconazole in recombinant CYP3A4 and CYP3A5 enzyme systems. Tacrolimus (1 μM) was incubated alone and with CBD (10 μM), 7‐OH CBD (10 μM), 7‐COOH CBD (10 μM), or ketoconazole (1 μM) in the presence of rCYP3A4 or rCYP3A5 (10 pmol/150 μL) and NADPH (1 mM) in phosphate buffer (0.2 M; pH 7.4) for 0, 1, 2.5, 5, 7.5, and 10 min. Tacrolimus depletion was quantified using the peak area ratio of tacrolimus to rapamycin, internal standard, and a standard curve (0–3 μM). The lower limit of quantification was 0.124 nM. For the incubation with rCYP3A4, the natural log‐transformed percentage tacrolimus remaining was plotted (A), and linear regression analysis was performed (B). For the incubation with rCYP3A5, the natural log‐transformed percentage tacrolimus remaining was plotted (C), and linear regression analysis was performed (D). Points represent the mean ± SD (A, C) or mean ± SEM (B, D) of two technical replicates. CBD, cannabidiol; rCYP, recombinant cytochrome P450; 7‐COOH CBD, 7‐carboxycannabidiol; 7‐OH CBD, 7‐hydroxycannabidiol. *adjusted p < 0.05; ****adjusted p < 0.0001.
TABLE 3.
Pharmacokinetic parameters of tacrolimus depletion with rCYP3A4 and rCYP3A5.
| Tacrolimus | Tacrolimus + Ketoconazole | Tacrolimus + CBD | Tacrolimus + 7‐OH CBD | Tacrolimus + 7‐COOH CBD | |
|---|---|---|---|---|---|
| rCYP3A4 (furCYP3A4 = 0.94) | |||||
| k dep (min−1) | 0.75 ± 0.046 | 0.086 ± 0.017 | 0.11 ± 0.017 | 0.050 ± 0.015 | 0.66 ± 0.042 |
| t 1/2 (min) | 0.92 | 8.06 | 6.11 | 14.0 | 1.05 |
| CLint,rCYP3A4 (μL/min/pmol CYP3A4) | 12.0 | 1.37 | 1.81 | 0.79 | 10.5 |
| rCYP3A5 (furCYP3A5 = 0.94) | |||||
| k dep (min−1) | 1.97 ± 0.23 | 0.72 ± 0.046 | 0.065 ± 0.0083 | 0.095 ± 0.018 | 1.75 ± 0.14 |
| t 1/2 (min) | 0.35 | 0.96 | 10.6 | 7.30 | 0.40 |
| CLint,rCYP3A5 (μL/min/pmol CYP3A5) | 31.5 | 11.5 | 1.04 | 1.52 | 27.9 |
Note: Data for k dep are presented in mean ± SEM. Values less than 1 are rounded to two significant figures, while all other values are rounded to three significant figures.
Abbreviations: CBD, cannabidiol; CLint,rCYP3A4, in vitro intrinsic clearance of tacrolimus in recombinant CYP3A4 enzymes; CLint,rCYP3A5, in vitro intrinsic clearance of tacrolimus in recombinant CYP3A5 enzymes; furCYP3A4, fraction unbound in recombinant CYP3A4 incubation; furCYP3A5, fraction unbound in recombinant CYP3A5 incubation; k dep, depletion rate constant; t 1/2, half‐life; 7‐COOH CBD, 7‐carboxycannabidiol; 7‐OH CBD, 7‐hydroxycannabidiol.
For rCYP3A5, CBD and 7‐OH CBD inhibited tacrolimus depletion more than ketoconazole (Figure 4). CBD slowed tacrolimus k dep with rCYP3A5 from 1.97 ± 0.23 min−1 to 0.065 ± 0.0083 min−1 (29.3‐fold reduction, p = 0.01), and 7‐OH CBD slowed it to 0.095 ± 0.018 min−1 (19.7‐fold reduction, p = 0.01) (Table 3). In contrast, ketoconazole only slowed tacrolimus k dep to 1.75 ± 0.14 min−1 (reduced by 11%, p = 0.04). Similar to the rCYP3A4 experiment, 7‐COOH CBD did not change tacrolimus depletion (p = 0.87). The calculated t 1/2 of tacrolimus was 0.35 min with rCYP3A5. CBD, 7‐OH CBD, and ketoconazole prolonged it to 10.6 min, 7.30 min, and 0.96 min, respectively (same fold‐change magnitude as k dep).
The unbound CLint,rCYP3A4 and CLint,rCYP3A5 were 12.0 μL/min/pmol and 31.5 μL/min/pmol, respectively. These vary from reported values of 38.1 μL/min/pmol for rCYP3A4 and 81.0 μL/min/pmol for rCYP3A5 [8]. Although a similar relative proportion between enzymes was observed, the difference in magnitude could arise from the incubations systems or misalignment between the estimated and actual fraction unbound in the recombinant systems. Therefore, the analysis of the results for recombinant enzymes was confined to within the study.
Comparing across the recombinant enzymes, CBD demonstrated a greater selective inhibition towards CYP3A5 than CYP3A4 (Figure S1, Tables S2 and S3). On the other hand, the active metabolite 7‐OH CBD showed a comparable extent of inhibition towards both enzymes, but slightly higher towards CYP3A5. No significant inhibition on tacrolimus depletion was observed for 7‐COOH CBD with either recombinant enzyme. Ketoconazole predominantly inhibited CYP3A4, consistent with literature evidence for other CYP3A substrates including midazolam, triazolam, nifedipine, and testosterone [42].
For conceptual validation, we evaluated tacrolimus depletion curves in CYP3A5 expression‐specific HLMs for tacrolimus alone, tacrolimus with CBD, and tacrolimus with 7‐OH CBD (Figure S2). Protein levels were quantitated by mass spectroscopy to determine the CY3A5 expression status. Both expression‐specific HLM conditions had less than half the CYP3A4 protein expression of the HLM pool. As compared to the rCYP3A5 condition, CBD and 7‐OH CBD elicited a similar magnitude of inhibition in CYP3A5 expressing HLMs (Figure S2C).
4. Discussion
Our results show that CBD and 7‐OH CBD were inhibitors of tacrolimus metabolism in pooled HLMs. For tacrolimus depletion in a rCYP3A4 system, the inhibitory activity of CBD and 7‐OH CBD was largely comparable to that of ketoconazole. For rCYP3A5, both CBD and 7‐OH CBD showed stronger inhibition of tacrolimus depletion than ketoconazole. The major metabolite 7‐COOH CBD showed minimal inhibition of tacrolimus depletion in pooled HLMs and in both recombinant enzyme systems.
Tacrolimus is exclusively metabolized through CYP3A4 and CYP3A5 when scaled to organ level [7]. Our data show that the in vitro intrinsic clearance ratio of rCYP3A5 to rCYP3A4 was 2.6, which is broadly consistent with published data of up to 2.1 [8, 9]. The slight difference may be related to differences in the efficiency of the recombinant enzyme systems used, or from our experimental design of measuring substrate depletion rather than metabolite formation. For example, estimation of the Michaelis constant (K m) for midazolam with CYP3A4 via substrate depletion was approximately two‐fold different than that measured via substrate formation [43]. Regardless, the higher catalytic efficiency of CYP3A5 emphasizes the importance of CYP3A5 expression to tacrolimus metabolism in vitro.
In our IVIVE model, the intrinsic clearance from pooled HLMs (CLint,HLM) underpredicted the observed total body clearance of tacrolimus, which is effectively equivalent to hepatic clearance because it is metabolized more than 99% and eliminated unchanged in urine less than 1% [41]. Similarly, the extrapolated EH,B of tacrolimus underpredicted observed data by 0.9‐ to 4.5‐fold. Such underprediction is not uncommon, though the mechanism remains unknown [44, 45]. However, it may be due to in vitro and in vivo differences in enzyme activity or fraction unbound as well as demographic differences between the HLM donors and the individuals contributing to the published data for CLH,B and EH,B. Overall, our findings agree with literature evidence that tacrolimus has a low extraction ratio (EH,B < 0.3) based on blood measurements. This indicates tacrolimus is dependent on hepatic intrinsic clearance of unbound drugs instead of hepatic blood flow. When unbound from hematocrit and plasma protein in the liver, tacrolimus is available for metabolism by CYP3A4 and CYP3A5. Both enzymes are important for tacrolimus metabolism, but CYP3A5 exhibits greater variability in expression among individuals and catalyzes tacrolimus more efficiently in vitro. The variability and efficiency in enzyme activity may translate to differences in tacrolimus metabolism in humans. Prior data suggested that CYP3A5 polymorphisms account for up to 45% of variability in tacrolimus dosing [14], highlighting the importance of practicing caution with concomitant CYP3A5 inhibitors or inducers.
Drug–drug interactions between tacrolimus and CYP3A inhibitors are well‐studied. CYP3A4 and CYP3A5 inhibitors can have inhibitor‐ and substrate‐dependent inhibition because of the overlapping substrate specificity, resulting from their highly similar amino acid sequence identity [46, 47]. CYP3A inhibition slows tacrolimus metabolic clearance, thus increasing the systemic concentration and exposure of tacrolimus. CYP3A inhibitors against tacrolimus can largely be classified into two types based on pharmacokinetic outcomes—CYP3A4‐selective inhibitors and CYP3A5‐selective inhibitors. CYP3A4‐selective inhibitors will increase tacrolimus exposure more in CYP3A5 non‐expressors than in expressors. CYP3A5 expressors have hepatic CYP3A5 abundance of 21–202 pmol/mg protein, whereas it is < 21 pmol/mg protein in non‐expressors [48]. Therefore, CYP3A5 non‐expressors have little to no CYP3A5 available to compensate for tacrolimus metabolism when CYP3A4 is inhibited. Ketoconazole, itraconazole, and nifedipine are examples of CYP3A4‐selective inhibitors [49, 50, 51]. On the other hand, CYP3A5‐selective inhibitors will show stronger inhibition in CYP3A5 expressors compared to non‐expressors. For example, in a clinical drug–drug interaction study, amlodipine increased AUC from time zero to infinity (AUC0–∞) of tacrolimus by 1.3‐fold in CYP3A5 expressors (p = 0.005), but it had no effect on that of CYP3A5 non‐expressors (p = 0.92) [52].
Recently, CBD was shown to be a moderate inhibitor of tacrolimus in vivo [24]. Our in vitro data support that CBD is a potent CYP3A5 inhibitor with relative selectivity compared to CYP3A4. CBD inhibited tacrolimus depletion more strongly in rCYP3A5 enzyme systems than rCYP3A4 systems. Similarly, a previous in vitro study showed that CBD exhibited six‐fold stronger inhibition towards CYP3A5 than CYP3A4 [20]. However, CYP3A5 was not considered in the New Drug Application (NDA) of CBD (Epidiolex) [53]. As part of the drug characterization process, a clinical DDI study was conducted with midazolam and found no significant interaction with steady‐state CBD. Both midazolam and tacrolimus are substrates of CYP3A4/5, but the midazolam in vivo clearances were independent of CYP3A5 genotype, meaning it is a more specific CYP3A4 probe substrate. Conversely, the steady‐state clearance of tacrolimus was 1.4‐fold higher in CYP3A5 expressors [18]. In short, midazolam may not be as sensitive to CYP3A5 metabolism as tacrolimus. Additionally, it is possible that the steady‐state plasma concentration of CBD (typically 1.05–1.72 μM) was too low to produce clinically significant inhibition on CYP3A4 to interact with midazolam [21]. The inhibitory potential of CBD towards CYP3A5 may therefore not have been realized, which presents an opportunity to further define the drug–drug interaction between CBD and tacrolimus, a sensitive CYP3A5 substrate.
The inhibition of CYP3A5 by CBD may be stronger in HLMs with higher abundance of CYP3A5. Our HLMs pool had a high contribution from Caucasians (88%). CYP3A5 is known to be expressed more in African Americans (88%) than Caucasians (16%) [54]. On this basis, our HLMs pool likely behaved more similar to CYP3A5 non‐expressors, with the observed inhibition of tacrolimus depletion driven mainly by CYP3A4 inhibition. A study estimated the relative contribution to tacrolimus metabolism by CYP3A4 and CYP3A5 to be 51% and 41%, respectively, with HLMs from a CYP3A5*1/*1 donor [55]. With CBD's selective inhibition towards CYP3A5, the difference can be significant in CYP3A5 expressors. In CYP3A5‐expressing HLMs, tacrolimus was depleted as expected and a similar magnitude of inhibition was observed with CBD and 7‐OH CBD. However, minimal depletion was observed in the non‐expresser CYP3A5 HLMs (Figure S2). Both expression‐specific HLM samples had low CYP3A4 protein expression as compared to the pooled HLM population which may have contributed to the lower than expected depletion in the CYP3A5 non‐expressing HLMs. To overcome these limitations, we employed the rCYP3A4 and rCYP3A5 enzymes.
The use of a single tacrolimus concentration may reduce the accuracy of in vivo scaling. However, we selected a concentration (1 μM) that is below the K m of 1.4 μM for CYP3A4 and 1.5 μM for CYP3A5 (unadjusted to fraction unbound) [9]. The concavity of the depletion curve with pooled HLMs may be related to time point selection with measurements longer than the depletion t 1/2. The curves plateaued as they approached lower concentrations and might have higher fluctuations resulting from assay sensitivity. This did not affect the determination of k dep and the subsequent kinetic parameters because only the data points in linear range were included in the regression analysis. On the other hand, the concavity of the depletion curve with rCYP3A5 may be due to its higher maximum velocity (V max) and turnover number (k cat) in tacrolimus metabolism. CYP3A5 has higher CLint but similar K m to CYP3A4 from literature, so CYP3A5 must have a higher V max (CLint = V max/K m) [8, 9]. Factors that influence V max include enzyme abundance and turnover number (V max = k cat [enzyme]). Our experiments used the same concentration of rCYP3A4 and rCYP3A5 that have the same enzyme abundance [56, 57]. By elimination, the higher k cat in CYP3A5 is the most probable rationale for the concavity observed in tacrolimus depletion with rCYP3A5. Additionally, the concentrations of CBD and 7‐OH CBD were not measured in the incubations. It is possible that CBD and 7‐OH CBD were metabolized by CYP3A during the tacrolimus depletion experiments, although the specific conversion of CBD to 7‐OH CBD is mediated by CYP2C19 and CYP2C9, not CYP3A. Reduced residence times of each compound in incubations may have contributed in part to the observed pharmacokinetics. This phenomenon would be expected in vivo as well.
Additional limitations were observed. First, inhaled and sublingual administration of CBD results in a much shorter half‐life [58] than that of the FDA‐approved orally administered Epidiolex which has a half‐life of 56–61 h [16]. Finally, we did not measure the fraction unbound experimentally. While the IC50,u of combined CYP3A4/CYP3A5 is 0.38 ± 0.11 μM [59], we could not identify a reported IC50,u specific to CYP3A5 and used a fu,mic as modeled by Certara [32].
As a potential CYP3A5 selective inhibitor, CBD may impact the dosing of clinically prescribed drugs with CYP3A5 genotype‐dependent pharmacokinetics including tacrolimus, sirolimus, cyclosporine, saquinavir, vincristine, and statins [60]. Furthermore, CBD could aid in vitro identification of CYP3A5 substrates in drug development. Past clinical trials enrolled predominantly Caucasian participants who were mainly CYP3A5 non‐expressors, so the differential characterization of CYP3A4 and CYP3A5 for a drug may have been less significant. However, the clinical trial demographics are now more diversified and inclusive. Black and Asian populations have higher proportions of CYP3A5 expressors. As a result, identification of a CYP3A5‐specific substrate and inhibitor may prove important for future drug discovery.
In conclusion, our results suggest that CBD and 7‐OH CBD are inhibitors of tacrolimus metabolism. Our study adds to the body of evidence of using CBD as an in vitro CYP3A5‐selective inhibitor, which could help identify CYP3A5 substrates during new drug development. Additionally, our study points to the possibility of a clinically relevant drug–drug interaction between CBD and tacrolimus. Considering the prevalence of CBD use, there is a pressing need to assess the safety of co‐administering CBD and tacrolimus in clinical trials.
Author Contributions
G.C.S., R.M.F., Z.D., M.T.E. wrote the manuscript; G.C.S., D.L.G., Z.D., M.T.E. designed the research; G.C.S., J.B.L.L., Y.‐H.C., D.L.G., S.K., T.R.B., M.T.E. performed the research; G.C.S., J.B.L.L., Y.‐H.C., D.L.G., Z.D., M.T.E. analyzed the data; Z.D. contributed new reagents/analytical tools.
Conflicts of Interest
The authors declare no conflicts of interest.
Supporting information
Data S1.
Funding: This work was supported by the National Center for Complementary and Integrative Health [Grant R01AT011463] and the NIH/ National Institute of General Medical Sciences National (NIH/NIGMS) (Grant R35GM145383). This research was supported in part by the Intramural Research Program of the National Institutes of Health. Gerald C So was supported by the National Institutes of Health and the National Institute of General Medical Sciences [Grant T32GM008425].
Contributor Information
Zeruesenay Desta, Email: zdesta@iu.edu.
Michael T. Eadon, Email: meadon@iu.edu.
References
- 1. OPTN/SRTR 2022 Annual Data Report , “Organ Procurement and Transplantation Network (OPTN) and Scientific Registry of Transplant Recipients (SRTR),” accessed March 1, 2024, http://srtr.transplant.hrsa.gov/annual_reports/Default.aspx.
- 2. Adie S. K., Bitar A., Konerman M. C., et al., “Tacrolimus Time in Therapeutic Range and Long‐Term Outcomes in Heart Transplant Recipients,” Pharmacotherapy 42, no. 2 (2022): 106–111, 10.1002/phar.2653. [DOI] [PubMed] [Google Scholar]
- 3. Kelly D. A., Bucuvalas J. C., Alonso E. M., et al., “Long‐Term Medical Management of the Pediatric Patient After Liver Transplantation: 2013 Practice Guideline by the American Association for the Study of Liver Diseases and the American Society of Transplantation,” Liver Transplantation 19, no. 8 (2013): 798–825, 10.1002/lt.23697. [DOI] [PubMed] [Google Scholar]
- 4. Bottiger Y., Brattstrom C., Tyden G., Sawe J., and Groth C. G., “Tacrolimus Whole Blood Concentrations Correlate Closely to Side‐Effects in Renal Transplant Recipients,” British Journal of Clinical Pharmacology 48, no. 3 (1999): 445–448, 10.1046/j.1365-2125.1999.00007.x. [DOI] [PMC free article] [PubMed] [Google Scholar]
- 5. Naesens M., Kuypers D. R., and Sarwal M., “Calcineurin Inhibitor Nephrotoxicity,” Clinical Journal of the American Society of Nephrology 4, no. 2 (2009): 481–508, 10.2215/CJN.04800908. [DOI] [PubMed] [Google Scholar]
- 6. Farouk S. S. and Rein J. L., “The Many Faces of Calcineurin Inhibitor Toxicity‐What the FK?,” Advances in Chronic Kidney Disease 27, no. 1 (2020): 56–66, 10.1053/j.ackd.2019.08.006. [DOI] [PMC free article] [PubMed] [Google Scholar]
- 7. Chapron B., Risler L., Phillips B., Collins C., Thummel K., and Shen D., “Reversible, Time‐Dependent Inhibition of CYP3A‐Mediated Metabolism of Midazolam and Tacrolimus by Telaprevir in Human Liver Microsomes,” Journal of Pharmacy & Pharmaceutical Sciences 18, no. 1 (2015): 101–111, 10.18433/j3288c. [DOI] [PubMed] [Google Scholar]
- 8. Dai Y., Hebert M. F., Isoherranen N., et al., “Effect of CYP3A5 Polymorphism on Tacrolimus Metabolic Clearance In Vitro,” Drug Metabolism and Disposition 34, no. 5 (2006): 836–847, 10.1124/dmd.105.008680. [DOI] [PubMed] [Google Scholar]
- 9. Kamdem L. K., Streit F., Zanger U. M., et al., “Contribution of CYP3A5 to the In Vitro Hepatic Clearance of Tacrolimus,” Clinical Chemistry 51, no. 8 (2005): 1374–1381, 10.1373/clinchem.2005.050047. [DOI] [PubMed] [Google Scholar]
- 10. Choi Y., Jiang F., An H., Park H. J., Choi J. H., and Lee H., “A Pharmacogenomic Study on the Pharmacokinetics of Tacrolimus in Healthy Subjects Using the DMET(TM) Plus Platform,” Pharmacogenomics Journal 17, no. 2 (2017): 174–179, 10.1038/tpj.2015.99. [DOI] [PubMed] [Google Scholar]
- 11. Li J. L., Liu S., Fu Q., et al., “Interactive Effects of CYP3A4, CYP3A5, MDR1 and NR1I2 Polymorphisms on Tracrolimus Trough Concentrations in Early Postrenal Transplant Recipients,” Pharmacogenomics 16, no. 12 (2015): 1355–1365, 10.2217/pgs.15.78. [DOI] [PubMed] [Google Scholar]
- 12. Thongprayoon C., Hansrivijit P., Kovvuru K., et al., “Impacts of High Intra‐ and Inter‐Individual Variability in Tacrolimus Pharmacokinetics and Fast Tacrolimus Metabolism on Outcomes of Solid Organ Transplant Recipients,” Journal of Clinical Medicine 9, no. 7 (2020): 193, 10.3390/jcm9072193. [DOI] [PMC free article] [PubMed] [Google Scholar]
- 13. Birdwell K. A., Decker B., Barbarino J. M., et al., “Clinical Pharmacogenetics Implementation Consortium (CPIC) Guidelines for CYP3A5 Genotype and Tacrolimus Dosing,” Clinical Pharmacology and Therapeutics 98, no. 1 (2015): 19–24, 10.1002/cpt.113. [DOI] [PMC free article] [PubMed] [Google Scholar]
- 14. Haufroid V., Mourad M., Van Kerckhove V., et al., “The Effect of CYP3A5 and MDR1 (ABCB1) Polymorphisms on Cyclosporine and Tacrolimus Dose Requirements and Trough Blood Levels in Stable Renal Transplant Patients,” Pharmacogenetics 14, no. 3 (2004): 147–154, 10.1097/00008571-200403000-00002. [DOI] [PubMed] [Google Scholar]
- 15. Food and Drug Administration , “Epidiolex (Cannabidiol) Prescribing Information,” https://www.accessdata.fda.gov/drugsatfda_docs/label/2023/210365s020lbl.pdf.
- 16. Administration USFaD , “Epidiolex (Cannabidiol) Office of Clinical Pharmacology Integrated Review,” (NDA number 210365) 2017.
- 17. Bansal S., Zamarripa C. A., Spindle T. R., et al., “Evaluation of Cytochrome P450‐Mediated Cannabinoid‐Drug Interactions in Healthy Adult Participants,” Clinical Pharmacology and Therapeutics 114, no. 3 (2023): 693–703, 10.1002/cpt.2973. [DOI] [PMC free article] [PubMed] [Google Scholar]
- 18. de Jonge H., de Loor H., Verbeke K., Vanrenterghem Y., and Kuypers D. R., “Impact of CYP3A5 Genotype on Tacrolimus Versus Midazolam Clearance in Renal Transplant Recipients: New Insights in CYP3A5‐Mediated Drug Metabolism,” Pharmacogenomics 14, no. 12 (2013): 1467–1480, 10.2217/pgs.13.133. [DOI] [PubMed] [Google Scholar]
- 19. Peter J. U., Dieudonne P., and Zolk O., “Pharmacokinetics, Pharmacodynamics, and Side Effects of Midazolam: A Review and Case Example,” Pharmaceuticals (Basel) 17, no. 4 (2024): 473, 10.3390/ph17040473. [DOI] [PMC free article] [PubMed] [Google Scholar]
- 20. Yamaori S., Ebisawa J., Okushima Y., Yamamoto I., and Watanabe K., “Potent Inhibition of Human Cytochrome P450 3A Isoforms by Cannabidiol: Role of Phenolic Hydroxyl Groups in the Resorcinol Moiety,” Life Sciences 88, no. 15–16 (2011): 730–736, 10.1016/j.lfs.2011.02.017. [DOI] [PubMed] [Google Scholar]
- 21. Taylor L., Gidal B., Blakey G., Tayo B., and Morrison G., “A Phase I, Randomized, Double‐Blind, Placebo‐Controlled, Single Ascending Dose, Multiple Dose, and Food Effect Trial of the Safety, Tolerability and Pharmacokinetics of Highly Purified Cannabidiol in Healthy Subjects,” CNS Drugs 32, no. 11 (2018): 1053–1067, 10.1007/s40263-018-0578-5. [DOI] [PMC free article] [PubMed] [Google Scholar]
- 22. Leino A. D., Emoto C., Fukuda T., Privitera M., Vinks A. A., and Alloway R. R., “Evidence of a Clinically Significant Drug–Drug Interaction Between Cannabidiol and Tacrolimus,” American Journal of Transplantation 19, no. 10 (2019): 2944–2948, 10.1111/ajt.15398. [DOI] [PubMed] [Google Scholar]
- 23. Bacle A., Le Dare B., and Vigneau C., “Lessons for the Clinical Nephrologist: Unexplained Tacrolimus Overdose in a Kidney Transplant Patient,” Journal of Nephrology 35, no. 7 (2022): 1911–1913, 10.1007/s40620-022-01297-x. [DOI] [PubMed] [Google Scholar]
- 24. So G. C., Lu J. B. L., Koyama S., et al., “A Phase I Trial of the Pharmacokinetic Interaction Between Cannabidiol and Tacrolimus,” Clinical Pharmacology and Therapeutics (2024), 10.1002/cpt.3504. [DOI] [PMC free article] [PubMed] [Google Scholar]
- 25. Corroon J. and Phillips J. A., “A Cross‐Sectional Study of Cannabidiol Users,” Cannabis and Cannabinoid Research 3, no. 1 (2018): 152–161, 10.1089/can.2018.0006. [DOI] [PMC free article] [PubMed] [Google Scholar]
- 26. Yan K. and Forman L., “Cannabinoid Use Among Liver Transplant Recipients,” Liver Transplantation 27, no. 11 (2021): 1623–1632, 10.1002/lt.26103. [DOI] [PubMed] [Google Scholar]
- 27. Cunetti L., Manzo L., Peyraube R., Arnaiz J., Curi L., and Orihuela S., “Chronic Pain Treatment With Cannabidiol in Kidney Transplant Patients in Uruguay,” Transplantation Proceedings 50, no. 2 (2018): 461–464, 10.1016/j.transproceed.2017.12.042. [DOI] [PubMed] [Google Scholar]
- 28. Beers J. L., Fu D., and Jackson K. D., “Cytochrome P450‐Catalyzed Metabolism of Cannabidiol to the Active Metabolite 7‐Hydroxy‐Cannabidiol,” Drug Metabolism and Disposition 49, no. 10 (2021): 882–891, 10.1124/dmd.120.000350. [DOI] [PMC free article] [PubMed] [Google Scholar]
- 29. Beers J. L., Authement A. K., Isoherranen N., and Jackson K. D., “Cytosolic Enzymes Generate Cannabinoid Metabolites 7‐Carboxycannabidiol and 11‐Nor‐9‐Carboxytetrahydrocannabinol,” ACS Medicinal Chemistry Letters 14, no. 5 (2023): 614–620, 10.1021/acsmedchemlett.3c00017. [DOI] [PMC free article] [PubMed] [Google Scholar]
- 30. Iwasaki K., “Metabolism of Tacrolimus (FK506) and Recent Topics in Clinical Pharmacokinetics,” Drug Metabolism and Pharmacokinetics 22, no. 5 (2007): 328–335, 10.2133/dmpk.22.328. [DOI] [PubMed] [Google Scholar]
- 31. Williamson B., Harlfinger S., and McGinnity D. F., “Evaluation of the Disconnect Between Hepatocyte and Microsome Intrinsic Clearance and in Vitro in Vivo Extrapolation Performance,” Drug Metabolism and Disposition 48, no. 11 (2020): 1137–1146, 10.1124/dmd.120.000131. [DOI] [PubMed] [Google Scholar]
- 32. Turner D. B., Rostami‐Hodjegan A., Tucker G. T., and Yeo K. R., “Prediction of Non‐Specific Hepatic Microsomal Binding from Readily Available Physicochemical Properties,” (Certara; ), 9th European Regional International Society for the Study of Xenobiotics Meeting January 2006, accessed March 1, 2024, https://www.certara.com/app/uploads/Resources/Posters/DavidISSX2006.pdf. [Google Scholar]
- 33. Davies B. and Morris T., “Physiological Parameters in Laboratory Animals and Humans,” Pharmaceutical Research 10, no. 7 (1993): 1093–1095, 10.1023/a:1018943613122. [DOI] [PubMed] [Google Scholar]
- 34. Barter Z. E., Tucker G. T., and Rowland‐Yeo K., “Differences in Cytochrome p450‐Mediated Pharmacokinetics Between Chinese and Caucasian Populations Predicted by Mechanistic Physiologically Based Pharmacokinetic Modelling,” Clinical Pharmacokinetics 52, no. 12 (2013): 1085–1100, 10.1007/s40262-013-0089-y. [DOI] [PubMed] [Google Scholar]
- 35. Yang J., Jamei M., Yeo K. R., Rostami‐Hodjegan A., and Tucker G. T., “Misuse of the Well‐Stirred Model of Hepatic Drug Clearance,” Drug Metabolism and Disposition 35, no. 3 (2007): 501–502, 10.1124/dmd.106.013359. [DOI] [PubMed] [Google Scholar]
- 36. Parkinson A., “Regulatory Recommendations for Calculating the Unbound Maximum Hepatic Inlet Concentration: A Complicated Story With a Surprising and Happy Ending,” Drug Metabolism and Disposition 47, no. 7 (2019): 779–784, 10.1124/dmd.119.086496. [DOI] [PubMed] [Google Scholar]
- 37. Gertz M., Houston J. B., and Galetin A., “Physiologically Based Pharmacokinetic Modeling of Intestinal First‐Pass Metabolism of CYP3A Substrates With High Intestinal Extraction,” Drug Metabolism and Disposition 39, no. 9 (2011): 1633–1642, 10.1124/dmd.111.039248. [DOI] [PubMed] [Google Scholar]
- 38. Zahir H., McCaughan G., Gleeson M., Nand R. A., and McLachlan A. J., “Factors Affecting Variability in Distribution of Tacrolimus in Liver Transplant Recipients,” British Journal of Clinical Pharmacology 57, no. 3 (2004): 298–309, 10.1046/j.1365-2125.2003.02008.x. [DOI] [PMC free article] [PubMed] [Google Scholar]
- 39. Hakooz N., Ito K., Rawden H., et al., “Determination of a Human Hepatic Microsomal Scaling Factor for Predicting In Vivo Drug Clearance,” Pharmaceutical Research 23, no. 3 (2006): 533–539, 10.1007/s11095-006-9531-2. [DOI] [PubMed] [Google Scholar]
- 40. XenoTech , “Human Liver Microsomes – Pool of 50, Lot No. 2010065, H0610 Datasheet,” https://www.xenotech.com/wp‐content/uploads/2020/08/H0600_2010065.pdf.
- 41. Christians U., Jacobsen W., Benet L. Z., and Lampen A., “Mechanisms of Clinically Relevant Drug Interactions Associated With Tacrolimus,” Clinical Pharmacokinetics 41, no. 11 (2002): 813–851, 10.2165/00003088-200241110-00003. [DOI] [PubMed] [Google Scholar]
- 42. Patki K. C., Von Moltke L. L., and Greenblatt D. J., “In Vitro Metabolism of Midazolam, Triazolam, Nifedipine, and Testosterone by Human Liver Microsomes and Recombinant Cytochromes p450: Role of cyp3a4 and cyp3a5,” Drug Metabolism and Disposition 31, no. 7 (2003): 938–944, 10.1124/dmd.31.7.938. [DOI] [PubMed] [Google Scholar]
- 43. Obach R. S. and Reed‐Hagen A. E., “Measurement of Michaelis Constants for Cytochrome P450‐Mediated Biotransformation Reactions Using a Substrate Depletion Approach,” Drug Metabolism and Disposition 30, no. 7 (2002): 831–837, 10.1124/dmd.30.7.831. [DOI] [PubMed] [Google Scholar]
- 44. Bowman C. M. and Benet L. Z., “In Vitro‐In Vivo Extrapolation and Hepatic Clearance‐Dependent Underprediction,” Journal of Pharmaceutical Sciences 108, no. 7 (2019): 2500–2504, 10.1016/j.xphs.2019.02.009. [DOI] [PMC free article] [PubMed] [Google Scholar]
- 45. Sodhi J. K. and Benet L. Z., “Successful and Unsuccessful Prediction of Human Hepatic Clearance for Lead Optimization,” Journal of Medicinal Chemistry 64, no. 7 (2021): 3546–3559, 10.1021/acs.jmedchem.0c01930. [DOI] [PMC free article] [PubMed] [Google Scholar]
- 46. Shirasaka Y., Chang S. Y., Grubb M. F., et al., “Effect of CYP3A5 Expression on the Inhibition of CYP3A‐Catalyzed Drug Metabolism: Impact on Modeling CYP3A‐Mediated Drug‐Drug Interactions,” Drug Metabolism and Disposition 41, no. 8 (2013): 1566–1574, 10.1124/dmd.112.049940. [DOI] [PMC free article] [PubMed] [Google Scholar]
- 47. Liu Y. T., Hao H. P., Liu C. X., Wang G. J., and Xie H. G., “Drugs as CYP3A Probes, Inducers, and Inhibitors,” Drug Metabolism Reviews 39, no. 4 (2007): 699–721, 10.1080/03602530701690374. [DOI] [PubMed] [Google Scholar]
- 48. Kuehl P., Zhang J., Lin Y., et al., “Sequence Diversity in CYP3A Promoters and Characterization of the Genetic Basis of Polymorphic CYP3A5 Expression,” Nature Genetics 27, no. 4 (2001): 383–391, 10.1038/86882. [DOI] [PubMed] [Google Scholar]
- 49. Yang Y., Huang X., Shi Y., et al., “CYP3A5 Genotype‐Dependent Drug–Drug Interaction Between Tacrolimus and Nifedipine in Chinese Renal Transplant Patients,” Frontiers in Pharmacology 12 (2021): 692922, 10.3389/fphar.2021.692922. [DOI] [PMC free article] [PubMed] [Google Scholar]
- 50. Chandel N., Aggarwal P. K., Minz M., Sakhuja V., Kohli K. K., and Jha V., “CYP3A5*1/*3 Genotype Influences the Blood Concentration of Tacrolimus in Response to Metabolic Inhibition by Ketoconazole,” Pharmacogenetics and Genomics 19, no. 6 (2009): 458–463, 10.1097/FPC.0b013e32832bd085. [DOI] [PubMed] [Google Scholar]
- 51. Nara M., Takahashi N., Miura M., et al., “Effect of Itraconazole on the Concentrations of Tacrolimus and Cyclosporine in the Blood of Patients Receiving Allogeneic Hematopoietic Stem Cell Transplants,” European Journal of Clinical Pharmacology 69, no. 6 (2013): 1321–1329, 10.1007/s00228-013-1471-2. [DOI] [PubMed] [Google Scholar]
- 52. Zuo X. C., Zhou Y. N., Zhang B. K., et al., “Effect of CYP3A5*3 Polymorphism on Pharmacokinetic Drug Interaction Between Tacrolimus and Amlodipine,” Drug Metabolism and Pharmacokinetics 28, no. 5 (2013): 398–405, 10.2133/dmpk.dmpk-12-rg-148. [DOI] [PubMed] [Google Scholar]
- 53. Center for Drug Evaluation and Research , “Epidiolex (Cannabidiol) Clinical Pharmacology and Biopharmaceutics Review(s),” https://www.accessdata.fda.gov/drugsatfda_docs/nda/2018/210365Orig1s000ClinPharmR.pdf.
- 54. Chen L. and Prasad G. V. R., “CYP3A5 Polymorphisms in Renal Transplant Recipients: Influence on Tacrolimus Treatment,” Pharmacogenomics and Personalized Medicine 11 (2018): 23–33, 10.2147/PGPM.S107710. [DOI] [PMC free article] [PubMed] [Google Scholar]
- 55. Tseng E., Walsky R. L., R. A. Luzietti, Jr. , et al., “Relative Contributions of Cytochrome CYP3A4 Versus CYP3A5 for CYP3A‐Cleared Drugs Assessed In Vitro Using a CYP3A4‐Selective Inactivator (CYP3cide),” Drug Metabolism and Disposition 42, no. 7 (2014): 1163–1173, 10.1124/dmd.114.057000. [DOI] [PubMed] [Google Scholar]
- 56. Cypex , “Human CYP3A4R EasyCYP Bactosomes, Batch No. C3A4R057, CYP/EZ002 Datasheet,” https://bioivt.com/human‐easycyp‐bactosomes‐enzymes/CYP‐EZ002.
- 57. Cypex , “Human CYP3A5R EasyCYP Bactosomes, Batch No. C3A5R007, CYP/EZ046 Datasheet,” https://www.xenotech.com/wp‐content/uploads/2022/01/c3a5r007.pdf.
- 58. Millar S. A., Stone N. L., Yates A. S., and O'Sullivan S. E., “A Systematic Review on the Pharmacokinetics of Cannabidiol in Humans,” Frontiers in Pharmacology 9 (2018): 1365, 10.3389/fphar.2018.01365. [DOI] [PMC free article] [PubMed] [Google Scholar]
- 59. Bansal S., Maharao N., Paine M. F., and Unadkat J. D., “Predicting the Potential for Cannabinoids to Precipitate Pharmacokinetic Drug Interactions via Reversible Inhibition or Inactivation of Major Cytochromes P450,” Drug Metabolism and Disposition 48, no. 10 (2020): 1008–1017, 10.1124/dmd.120.000073. [DOI] [PMC free article] [PubMed] [Google Scholar]
- 60. Rodriguez‐Antona C., Savieo J. L., Lauschke V. M., et al., “PharmVar GeneFocus: CYP3A5,” Clinical Pharmacology and Therapeutics 112, no. 6 (2022): 1159–1171, 10.1002/cpt.2563. [DOI] [PMC free article] [PubMed] [Google Scholar]
Associated Data
This section collects any data citations, data availability statements, or supplementary materials included in this article.
Supplementary Materials
Data S1.