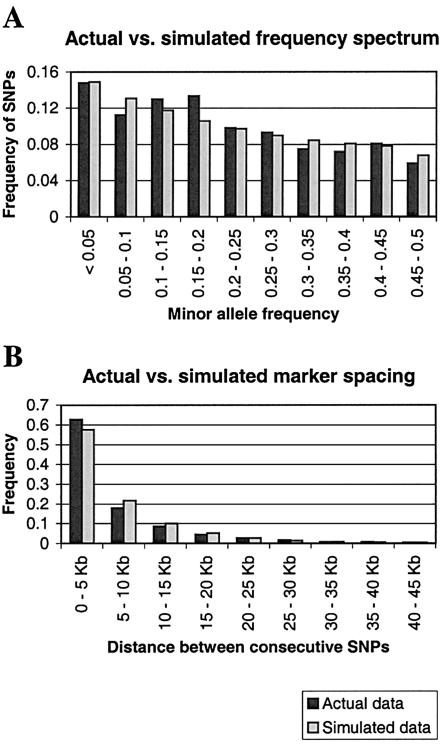
Figure 1.
Comparison of the actual (African sample from Gabriel et al. 2002) and simulated distributions of MAFs (A) and distances between neighboring markers with MAF ⩾0.1 (B). The distribution of allele frequencies was obtained by tabulating the first 80 informative chromosomes at each segregating site (i.e., the first 80 chromosomes that did not have missing data) and was compared with simulations of 80 chromosomes subject to the SNP ascertainment scheme described in the text. The simulated distribution of intermarker distances is an average over 100 replicates.

