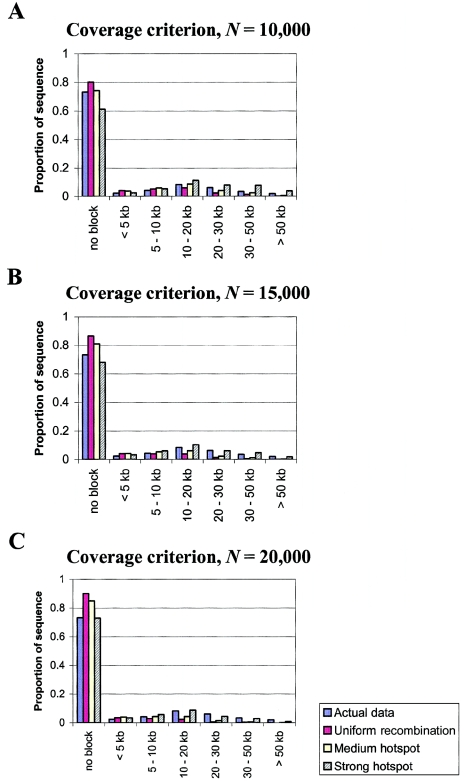
Figure 4.
Comparison of simulation results (under different recombination rate variation models) to the African population from Gabriel et al. (2002), using the three haplotype block criteria. A–C, Proportion of sequence contained in haplotype blocks of various sizes or not contained in blocks. D–F, Probability of violating the “hole” criterion as a function of the distance between the outermost markers. G–I, Probability of violating the “overlapping blocks” criterion as a function of the distance between the outermost markers. The simulations assume different population sizes: N=10,000 (A, D, and G); N=15,000 (B, E, and H); and N=20,000 (C, F, and I). See the “Material and Methods” section for more details.

