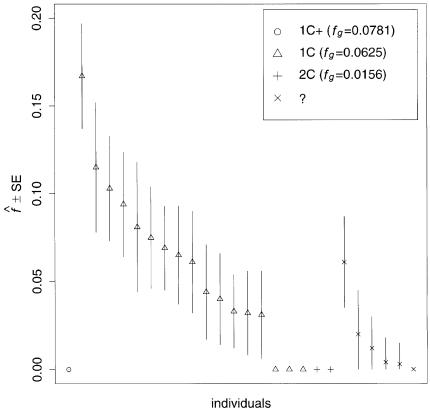
Figure 3.
Estimated f ( ) for the 26 individuals with CMT disease. Solid lines represent
  . SEs were obtained from the observed Fisher information matrix with 8,000 Monte Carlo realizations. 1C+ = first-cousin offspring whose paternal grandparents are also first cousins; 1C = first-cousin offspring; 2C = second-cousin offspring; ? = no genealogical information. fg is the proportion of genome IBD expected from the genealogy.

